UNITED
STATES
SECURITIES
AND EXCHANGE COMMISSION
Washington,
D.C. 20549
FORM
8-K
CURRENT
REPORT
Pursuant
to Section 13 or 15(d) of the Securities Exchange Act of 1934
|
Date
of Report (Date of earliest event reported):
|
October 22,
2008
|
AllianceBernstein
l.p.
(Exact
name of registrant as specified in its charter)
|
Delaware
|
000-29961
|
13-4064930
|
|
(State
or other jurisdiction of incorporation or organization)
|
(Commission
File Number)
|
(I.R.S.
Employer Identification
Number)
|
|
1345
Avenue of the Americas, New York, New York
|
10105
|
|
(Address
of principal executive offices)
|
(Zip
Code)
|
|
Registrant’s
telephone number, including area code:
|
212-969-1000
|
Check
the appropriate box below if the Form 8-K filing is intended to simultaneously
satisfy the filing obligations of the registrant under any of the following
provisions:
£ Written
communications pursuant to Rule 425 under the Securities Act (17 CFR
230.425)
£ Soliciting
material pursuant to Rule 14a-12 under the Exchange Act (17 CFR
240.14a-12)
£ Pre-commencement
communications pursuant to Rule 14d-2(b) under the Exchange Act (17 CFR
240.14d-2(b))
£ Pre-commencement
communications pursuant to Rule 13e-4(c) under the Exchange Act (17 CFR
240.13e-4(c))
|
Section
2.
|
Financial
Information
|
|
Item
2.02.
|
Results of Operations
and Financial Condition.
|
AllianceBernstein
L.P. (“AllianceBernstein”) is furnishing the news release it issued on October
22, 2008 concerning financial and operating results for the quarter ended
September 30, 2008 (“Release”). The Release is attached hereto as
Exhibit 99.01.
AllianceBernstein
is furnishing its Third Quarter 2008 Review, dated October 22, 2008
(“Review”). The Review is attached hereto as Exhibit
99.02.
AllianceBernstein
is furnishing a transcript of its conference call with analysts relating to the
Release and the Review (“Transcript”). The call took place on October
22, 2008. The Transcript is attached hereto as Exhibit
99.03.
|
Section
7.
|
Regulation
FD
|
|
Item
7.01.
|
Regulation FD
Disclosure.
|
AllianceBernstein
is furnishing the Release, which is attached hereto as Exhibit
99.01.
AllianceBernstein
is furnishing the Review, which is attached hereto as Exhibit
99.02.
AllianceBernstein
is furnishing the Transcript, which is attached hereto as Exhibit
99.03.
|
Section
9.
|
Financial Statements
and Exhibits
|
|
Item
9.01.
|
Financial Statements
and Exhibits.
|
|
|
(d)
|
Exhibits.
|
|
|
Release.
|
|
|
Review.
|
|
|
Transcript.
|
SIGNATURES
Pursuant
to the requirements of the Securities Exchange Act of 1934, the registrant has
duly caused this report to be signed on its behalf by the undersigned thereunto
duly authorized.
|
AllianceBernstein
l.p.
|
||
|
Dated: October
23, 2008
|
By:
|
/s/
Robert H. Joseph, Jr.
|
|
Robert
H. Joseph, Jr.
Senior
Vice President and
Chief
Financial
Officer
|
||
EXHIBIT
99.01
|
|
|
Philip
Talamo, Investor Relations
212.969.2383
ir@alliancebernstein.com
|
John
Meyers, Media
212.969.2301
pr@alliancebernstein.com
|
News
Release
AllianceBernstein
Holding L.P. Announces Third Quarter Diluted Net Income of $0.73 per
Unit;
Declares
a $0.60 per Unit Cash Distribution, which Excludes Insurance Recoveries of $0.13
per Unit
New
York, NY, October 22, 2008 – AllianceBernstein
Holding L.P. (“AllianceBernstein Holding”) (NYSE: AB) and
AllianceBernstein L.P. (“AllianceBernstein”) today reported financial and
operating results for the quarter ended September 30, 2008.
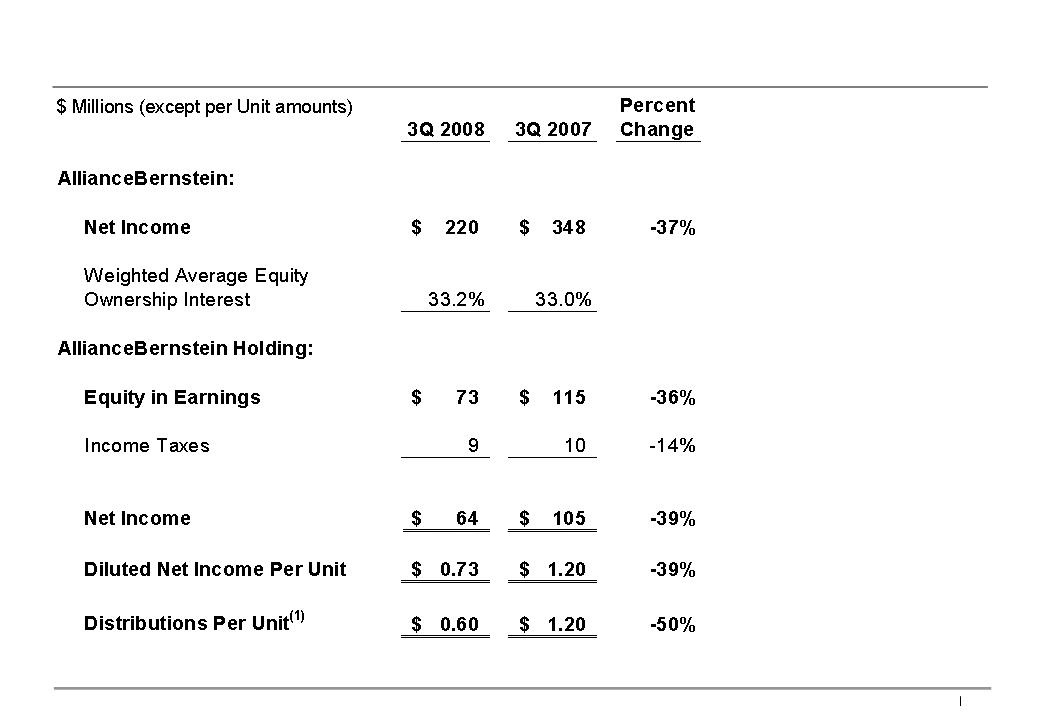
AllianceBernstein
Holding (The Publicly Traded Partnership):
|
·
|
Diluted net income per
Unit for the quarter ended September 30,
2008 was $0.73, a decrease of 39% from $1.20 for the same
period in 2007.
|
|
·
|
Distribution per Unit
for the third quarter of 2008 will be $0.60, a decrease of 50% from $1.20
for the same period in 2007. The distribution is payable on
November 13, 2008 to holders of record of AllianceBernstein Holding Units
at the close of business on November 3,
2008.
|
During
the third quarter of 2008, AllianceBernstein recorded
approximately $35.3 million in insurance recoveries relating to payments made
for a class action claims processing error. A reserve of $56.0
million was established in the fourth quarter of 2006 for this
error. AllianceBernstein Holding’s fourth quarter 2006 cash
distribution was based on net income before this charge. Accordingly,
these recoveries were not included in the per Unit cash distribution for the
current quarter.
AllianceBernstein
(The Operating Partnership):
|
·
|
Assets Under Management
(AUM) at September 30, 2008 were $590 billion, a 28% decrease from
a year ago, due to net outflows and substantial market
depreciation.
|
|
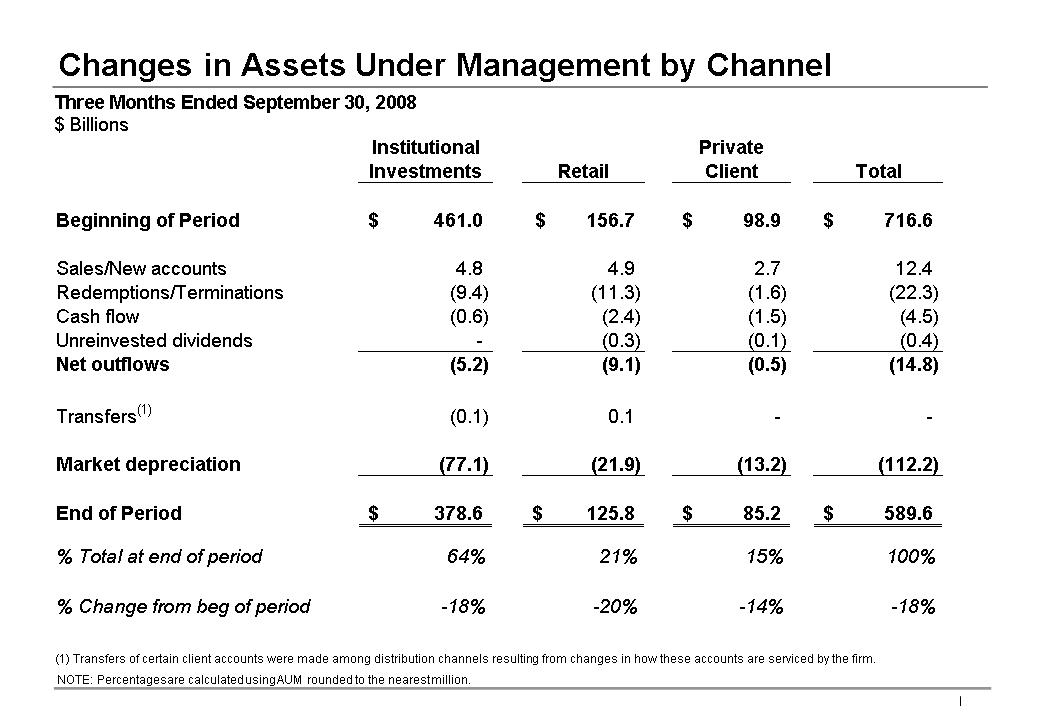
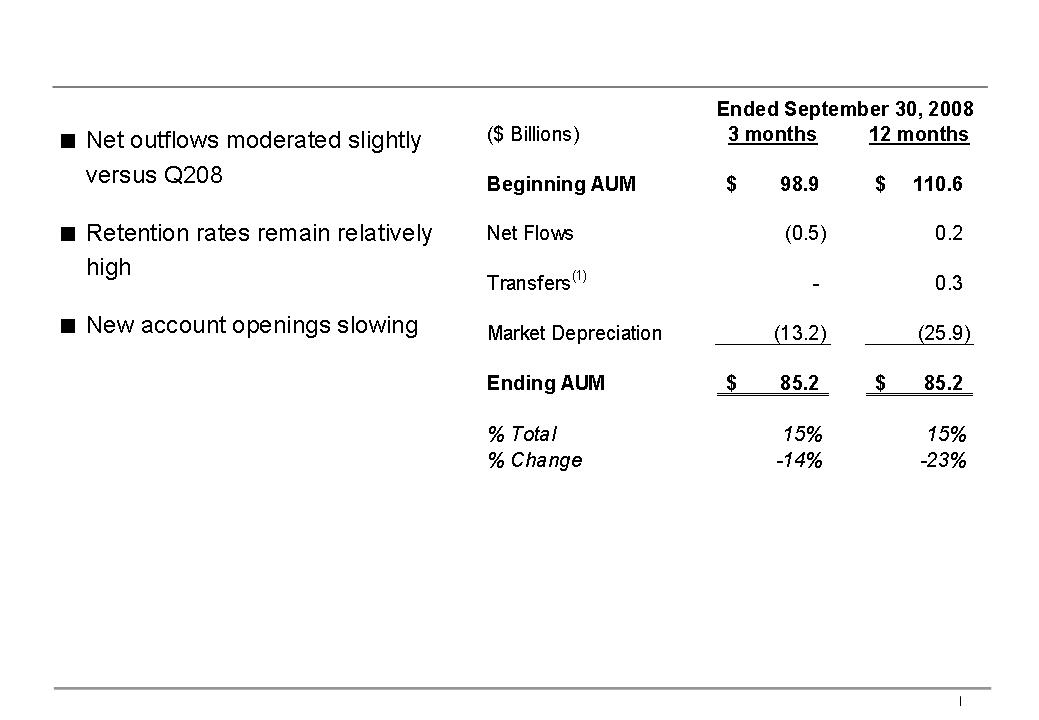
·
|
Net outflows for the three months
ended September 30, 2008 were $14.8 billion, consisting of Retail
net outflows of $9.1 billion, Institutional Investments net outflows of
$5.2 billion and Private Client net outflows of $0.5
billion.
|
|
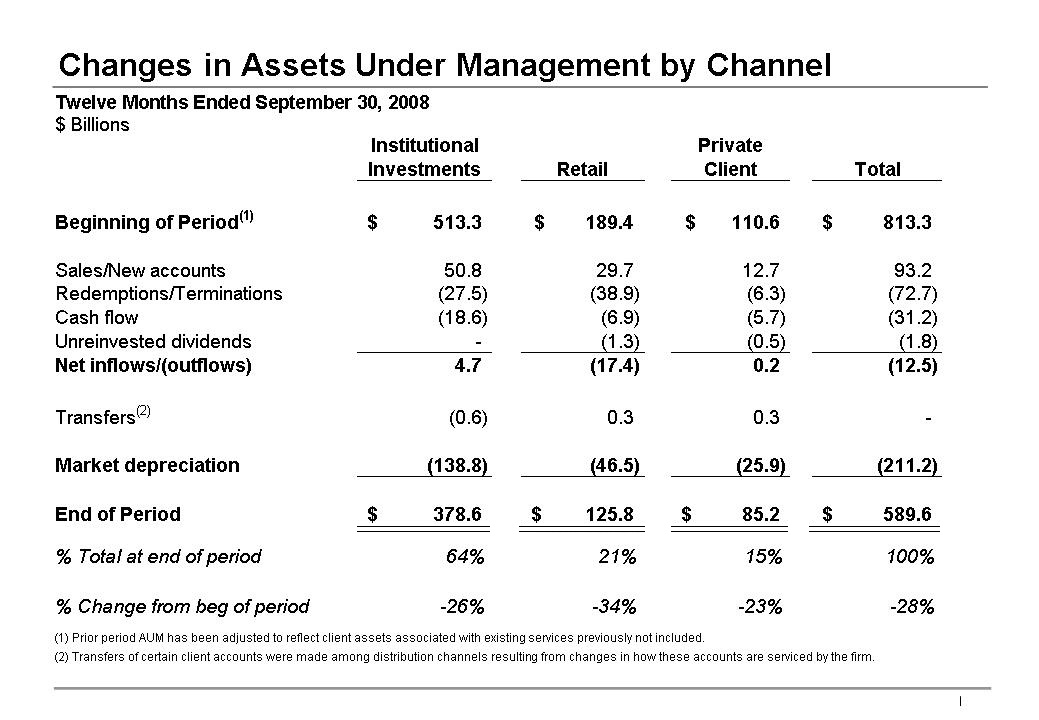
·
|
Net outflows for the twelve
months ended September 30, 2008 were $12.5 billion, consisting of
Retail net outflows of $17.4 billion, Institutional Investments net
inflows of $4.7 billion and Private Client net inflows of $0.2
billion.
|
“In the
third quarter of 2008, exceptionally turbulent capital market conditions led to
sharply negative absolute investment returns in most of our investment services.
Relative performance suffered as well, owing to our exposure to sectors directly
affected by the global financial crisis. Our substantial weighting of non-US
investments added still more downward pressure to results, as the US dollar
strengthened considerably during the quarter. While investment returns are
clearly disappointing, we continue to believe that client portfolios are
positioned to weather the current storm and recover strongly after it lifts.
Some of our best periods of absolute and relative returns have occurred in the
aftermath of prior bouts of market turbulence, and we anticipate that this
pattern will repeat itself in the current episode” said Lewis Sanders, Chairman
and Chief Executive Officer.
“The
firm’s organic growth remained negative in the third quarter, with outflows
accelerating versus the second quarter of 2008 in Retail and Institutional
Investments channels, while Private Client outflows remained
modest. Retail outflows were driven by both significantly slower
sales and a marked increase in redemptions. Institutional Investments outflows
were primarily a function of sharply lower sales, rather than higher account
terminations and the backlog of new but not yet funded institutional mandates
declined slightly to $14 billion. If history is a guide, the firm’s organic
growth will likely remain under considerable pressure until market conditions
improve.
“Our
institutional research services unit continued to perform very well, with
revenues in the third quarter up 21% year-over-year and 13% sequentially,
benefiting from strong volume growth and market share gains, especially in the
US. The firm continued to improve its competitive standing in research
quality. We ranked 6th in
Institutional Investor's recently released All-America poll and ten of our
analysts ranked #1 in their sector, the strongest showing in our
history.
“The
firm’s financial results were quite weak in the third quarter, as the
precipitous decline in the global capital markets impacted assets under
management and related fee revenue. The revenue decline was exacerbated by
losses of $123 million on investments related to employee deferred compensation,
which, net of lower compensation expenses and taxes, reduced reported earnings
by about $0.24 per Unit. Despite aggressive expense management, operating margin
fell year-over-year by 410 basis points to 28.8%. The margin decline was
moderated by insurance recoveries of approximately $35.3 million ($0.13 per
Unit) relating to a class action claims processing error for which a $56.0
million reserve was established in the fourth quarter of 2006. As
cash distributions to Unitholders were not reduced when the reserves were
established, the insurance recoveries are not included in distributable income
in the current quarter.
www.alliancebernstein.com
2 of
10
“With
assets under management now far below expectations, the company is moving to
reset its expense base and capital outlays to an appropriate level. The highly
variable nature of our cost structure will be helpful in accomplishing this
mission. However, a reduction in headcount, much of which will be implemented in
this year’s fourth quarter, is unavoidable and will result in a charge against
earnings, the size of which has not been determined. Additionally, capital
spending plans have been reduced to a level below depreciation and amortization.
These actions notwithstanding, we will be moving ahead on the new business
initiatives that we believe are most important to the firm’s future
growth.
“Of equal
importance, the firm’s solid financial foundation and limited use of its balance
sheet for purposes other than normal working capital requirements position us
well to navigate through this difficult period.
“These
are tough times, to be sure. In such times, having a single-minded
focus on producing superior investment returns and delivering world class
service to our clients is evermore important and remains the number one priority
of all AllianceBernstein employees,” concluded Mr. Sanders.
CONFERENCE
CALL INFORMATION RELATING TO THIRD QUARTER 2008 RESULTS
OCTOBER
22, 2008 AT 5:00 P.M. (Eastern Daylight Time)
AllianceBernstein’s
management will review third quarter 2008 financial and operating results on
Wednesday, October 22, 2008, during a conference call beginning at 5:00 p.m.
(EDT),
following the release of its financial results after the close of the New York
Stock Exchange. The conference call will be hosted by Lewis A.
Sanders, Chairman and Chief Executive Officer, and Gerald M. Lieberman,
President and Chief Operating Officer.
Parties
may access the conference call by either webcast or telephone:
|
1.
|
To
listen by webcast, please visit AllianceBernstein’s Investor Relations
website at http://ir.alliancebernstein.com/investorrelations
at least 15 minutes prior to the call to download and install any
necessary audio software.
|
|
2.
|
To
listen by telephone, please dial (866) 556-2265 in the U.S. or (973)
935-8521 outside the U.S., 10 minutes before the 5:00 p.m. (EDT)
scheduled start time. The conference ID# is
68115800.
|
The
presentation that will be reviewed during the conference call will be made
available on AllianceBernstein’s Investor Relations website shortly after the
release of third quarter 2008 financial results on October 22,
2008.
An audio
replay of the conference call will be made available beginning at approximately
7:00 p.m. (EDT) on October 22, 2008 and will be available for one week. To
access the audio replay, please call (800) 642-1687 from the U.S., or outside
the U.S. call (706) 645-9291, and provide conference ID#
68115800. The replay will also be available via webcast on
AllianceBernstein’s website for one week.
www.alliancebernstein.com
3 of
10
About
AllianceBernstein
AllianceBernstein
is a leading global investment management firm that offers high-quality research
and diversified investment services to institutional clients, individuals and
private clients in major markets around the world. AllianceBernstein
employs more than 500 investment professionals with expertise in growth
equities, value equities, fixed income securities, blend strategies and
alternative investments and, through its subsidiaries and joint ventures,
operates in more than 20 countries. AllianceBernstein’s research
disciplines include fundamental research, quantitative research, economic
research and currency forecasting capabilities. Through its
integrated global platform, AllianceBernstein is well-positioned to tailor
investment solutions for its clients. AllianceBernstein also offers independent
research, portfolio strategy and brokerage-related services to institutional
investors.
At
September 30, 2008, AllianceBernstein Holding L.P. (“Holding”) owned
approximately 33.6% of the issued and outstanding AllianceBernstein
Units. AXA Financial was the beneficial owner of approximately 62.6%
of the AllianceBernstein Units at September 30, 2008 (including those held
indirectly through its ownership of approximately 1.6% of the issued and
outstanding Holding Units) which, including the general partnership interests in
AllianceBernstein and Holding, represent an approximate 63.0% economic interest
in AllianceBernstein. AXA Financial is a wholly-owned subsidiary of
AXA, one of the largest global financial services organizations.
Cautions
regarding Forward-Looking Statements
Certain
statements provided by management in this news release are “forward-looking
statements” within the meaning of the Private Securities Litigation Reform Act
of 1995. Such forward-looking statements are subject to risks, uncertainties,
and other factors that could cause actual results to differ materially from
future results expressed or implied by such forward-looking statements. The most
significant of these factors include, but are not limited to, the following: the
performance of financial markets, the investment performance of sponsored
investment products and separately managed accounts, general economic
conditions, future acquisitions, competitive conditions, and government
regulations, including changes in tax regulations and rates and the manner in
which the earnings of publicly traded partnerships are taxed. We caution readers
to carefully consider such factors. Further, such forward-looking statements
speak only as of the date on which such statements are made; we undertake no
obligation to update any forward-looking statements to reflect events or
circumstances after the date of such statements. For further information
regarding these forward-looking statements and the factors that could cause
actual results to differ, see “Risk Factors” in Part I, Item 1A of
our Form 10-K for the year ended December 31, 2007 and Part II, Item 1A of our
Form 10-Q for the quarter ended June 30, 2008. Any or all of the forward-looking
statements that we make in this news release, Form 10-K, Form 10-Q, other
documents we file with or furnish to the SEC, or any other public statements we
issue, may turn out to be wrong. It is important to remember that other factors
besides those listed in “Risk Factors” and those listed above and below could
also adversely affect our revenues, financial condition, results of operations,
and business prospects.
www.alliancebernstein.com
4 of
10
The
forward-looking statements referred to in the preceding paragraph include
statements regarding:
|
|
·
|
Our
anticipation that the historical pattern of some of our best absolute and
relative returns following bouts of market turbulence will repeat itself
in the current episode, and our confidence
that the actions we are taking will position us to take advantage of a
recovery for our clients and for the firm which history tells us will
arrive sooner and be stronger than generally expected: Historical
performance is not necessarily indicative of future results or market
movements. The actual performance of the capital markets and
other factors beyond our control will affect our investment success for
clients and asset flows.
|
|
|
·
|
Our backlog
of new institutional mandates not yet funded: Before they are
funded, institutional mandates do not represent legally binding
commitments to fund and, accordingly, the possibility exists that not all
mandates will be funded in the amounts and at the times we currently
anticipate.
|
|
|
·
|
The firm’s
solid financial foundation positioning it well to navigate through this
difficult period: Our solid financial foundation is
dependent on our cash flow from operations, which is subject to the
performance of the capital markets and other factors beyond our
control.
|
www.alliancebernstein.com
5 of
10
ALLIANCEBERNSTEIN
L.P.
(THE
OPERATING PARTNERSHIP)
SUMMARY
CONSOLIDATED STATEMENTS OF INCOME
SEPTEMBER
30, 2008
(unaudited,
$ thousands)
|
Three Months Ended
|
||||||||
|
9/30/08
|
9/30/07
|
|||||||
|
Revenues:
|
||||||||
|
Investment
Advisory & Services Fees
|
$ | 713,229 | $ | 870,282 | ||||
|
Distribution
Revenues
|
96,711 | 120,289 | ||||||
|
Institutional
Research Services
|
124,854 | 103,552 | ||||||
|
Dividend
and Interest Income
|
18,937 | 72,665 | ||||||
|
Investment
Gains (Losses)
|
(131,920 | ) | 10,200 | |||||
|
Other
Revenues
|
28,230 | 30,856 | ||||||
|
Total
Revenues
|
850,041 | 1,207,844 | ||||||
|
Less:
Interest Expense
|
9,050 | 55,022 | ||||||
|
Net
Revenues
|
840,991 | 1,152,822 | ||||||
|
Expenses:
|
||||||||
|
Employee
Compensation & Benefits
|
328,614 | 446,938 | ||||||
|
Promotion
& Servicing:
|
||||||||
|
Distribution
Plan Payments
|
69,994 | 86,230 | ||||||
|
Amortization
of Deferred Sales Commissions
|
19,324 | 23,739 | ||||||
|
Other
|
50,013 | 61,192 | ||||||
|
General
& Administrative
|
114,333 | 141,894 | ||||||
|
Interest
on Borrowings
|
2,117 | 5,965 | ||||||
|
Amortization
of Intangible Assets
|
5,179 | 5,179 | ||||||
| 589,574 | 771,137 | |||||||
|
Operating
Income
|
251,417 | 381,685 | ||||||
|
Non-Operating
Income
|
4,921 | 3,353 | ||||||
|
Income
before Income Taxes and Non-Controlling
|
||||||||
|
Interest
in Earnings of Consolidated Entities
|
256,338 | 385,038 | ||||||
|
Income
Taxes
|
27,258 | 34,574 | ||||||
|
Non-Controlling
Interest in Earnings of Consolidated Entities,
|
||||||||
|
Net
of Taxes
|
9,551 | 2,382 | ||||||
|
NET
INCOME
|
$ | 219,529 | $ | 348,082 | ||||
|
Operating
Margin(1)
|
28.8 | % | 32.9 | % | ||||
www.alliancebernstein.com
6 of
10
ALLIANCEBERNSTEIN HOLDING
L.P.
(THE
PUBLICLY TRADED PARTNERSHIP)
SUMMARY
STATEMENTS OF INCOME
(unaudited,
$ thousands except per unit amounts)
|
Three Months Ended
|
||||||||
|
9/30/08
|
9/30/07
|
|||||||
|
Equity
in Earnings of Operating Partnership
|
$ | 72,936 | $ | 114,856 | ||||
|
Income
Taxes
|
8,575 | 10,028 | ||||||
|
NET
INCOME
|
64,361 | 104,828 | ||||||
|
Additional
Equity in Earnings of Operating Partnership(1)
|
251 | 1,243 | ||||||
|
NET
INCOME - Diluted(2)
|
$ | 64,612 | $ | 106,071 | ||||
|
DILUTED
NET INCOME PER UNIT
|
$ | 0.73 | $ | 1.20 | ||||
|
DISTRIBUTION
PER UNIT(3)
|
$ | 0.60 | $ | 1.20 | ||||
(1) To
reflect higher ownership in the Operating Partnership resulting from application
of the treasury stock method to outstanding options.
(2) For
calculation of Diluted Net Income per Unit.
(3)
Excludes insurance recoveries related to class action claims processing
error.
ALLIANCEBERNSTEIN L.P. AND ALLIANCEBERNSTEIN HOLDING
L.P.
UNITS
OUTSTANDING AND WEIGHTED AVERAGE UNITS OUTSTANDING
SEPTEMBER
30, 2008
|
Weighted
Average Units Three Months
Ended
|
||||||||||||
|
Period
End
|
||||||||||||
|
Units
|
Basic
|
Diluted
|
||||||||||
|
AllianceBernstein
L.P.
|
260,989,769 | 260,975,837 | 261,490,610 | |||||||||
|
AllianceBernstein
Holding
|
87,595,926 | 87,581,994 | 88,096,767 | |||||||||
www.alliancebernstein.com
7 of
10
ALLIANCEBERNSTEIN L.P.
ASSETS
UNDER MANAGEMENT
THREE
MONTHS ENDED SEPTEMBER 30, 2008
($
billions)
|
Institutional
Investments
|
Retail
|
Private
Client
|
Total
|
|||||||||||||
|
Beginning
of Period
|
$ | 461.0 | $ | 156.7 | $ | 98.9 | $ | 716.6 | ||||||||
|
Sales/New
accounts
|
4.8 | 4.9 | 2.7 | 12.4 | ||||||||||||
|
Redemptions/Terminations
|
(9.4 | ) | (11.3 | ) | (1.6 | ) | (22.3 | ) | ||||||||
|
Cash
flow
|
(0.6 | ) | (2.4 | ) | (1.5 | ) | (4.5 | ) | ||||||||
|
Unreinvested
dividends
|
- | (0.3 | ) | (0.1 | ) | (0.4 | ) | |||||||||
|
Net
outflows
|
(5.2 | ) | (9.1 | ) | (0.5 | ) | (14.8 | ) | ||||||||
|
Transfers(1)
|
(0.1 | ) | 0.1 | - | - | |||||||||||
|
Market
depreciation
|
(77.1 | ) | (21.9 | ) | (13.2 | ) | (112.2 | ) | ||||||||
|
End
of Period
|
$ | 378.6 | $ | 125.8 | $ | 85.2 | $ | 589.6 | ||||||||
(1)
Transfers of certain client accounts were made among distribution channels
resulting from changes in how these accounts are serviced by the
firm.
ALLIANCEBERNSTEIN L.P.
ASSETS
UNDER MANAGEMENT
TWELVE
MONTHS ENDED SEPTEMBER 30, 2008
($
billions)
|
Institutional
Investments
|
Retail
|
Private
Client
|
Total
|
|||||||||||||
|
Beginning
of Period(1)
|
$ | 513.3 | $ | 189.4 | $ | 110.6 | $ | 813.3 | ||||||||
|
Sales/New
accounts
|
50.8 | 29.7 | 12.7 | 93.2 | ||||||||||||
|
Redemptions/Terminations
|
(27.5 | ) | (38.9 | ) | (6.3 | ) | (72.7 | ) | ||||||||
|
Cash
flow
|
(18.6 | ) | (6.9 | ) | (5.7 | ) | (31.2 | ) | ||||||||
|
Unreinvested
dividends
|
- | (1.3 | ) | (0.5 | ) | (1.8 | ) | |||||||||
|
Net
inflows/(outflows)
|
4.7 | (17.4 | ) | 0.2 | (12.5 | ) | ||||||||||
|
Transfers(2)
|
(0.6 | ) | 0.3 | 0.3 | - | |||||||||||
|
Market
depreciation
|
(138.8 | ) | (46.5 | ) | (25.9 | ) | (211.2 | ) | ||||||||
|
End
of Period
|
$ | 378.6 | $ | 125.8 | $ | 85.2 | $ | 589.6 | ||||||||
(1) Prior
period AUM has been adjusted to reflect client assets associated with existing
services previously not included.
(2)
Transfers of certain client accounts were made among distribution channels
resulting from changes in how these accounts are serviced by the
firm.
www.alliancebernstein.com
8 of
10
ALLIANCEBERNSTEIN L.P.
ASSETS
UNDER MANAGEMENT
BY
INVESTMENT SERVICE
AT
SEPTEMBER 30, 2008
($
billions)
|
Institutional Investments
|
Retail
|
Private Client
|
Total
|
|||||||||||||
|
Equity:
|
||||||||||||||||
|
Value
|
||||||||||||||||
|
U.S.
|
$ | 33.1 | $ | 21.4 | $ | 17.7 | $ | 72.2 | ||||||||
|
Global
& International
|
127.6 | 35.8 | 16.5 | 179.9 | ||||||||||||
| 160.7 | 57.2 | 34.2 | 252.1 | |||||||||||||
|
Growth
|
||||||||||||||||
|
U.S.
|
21.8 | 16.3 | 11.6 | 49.7 | ||||||||||||
|
Global
& International
|
58.9 | 14.8 | 8.2 | 81.9 | ||||||||||||
| 80.7 | 31.1 | 19.8 | 131.6 | |||||||||||||
|
Total
Equity
|
241.4 | 88.3 | 54.0 | 383.7 | ||||||||||||
|
Fixed
Income:
|
||||||||||||||||
|
U.S.
|
67.2 | 9.2 | 30.4 | 106.8 | ||||||||||||
|
Global
& International
|
54.7 | 24.8 | 0.8 | 80.3 | ||||||||||||
| 121.9 | 34.0 | 31.2 | 187.1 | |||||||||||||
|
Other(1)
|
||||||||||||||||
|
U.S.
|
8.4 | 3.5 | - | 11.9 | ||||||||||||
|
Global
& International
|
6.9 | - | - | 6.9 | ||||||||||||
| 15.3 | 3.5 | - | 18.8 | |||||||||||||
|
Total:
|
||||||||||||||||
|
U.S.
|
130.5 | 50.4 | 59.7 | 240.6 | ||||||||||||
|
Global
& International
|
248.1 | 75.4 | 25.5 | 349.0 | ||||||||||||
| $ | 378.6 | $ | 125.8 | $ | 85.2 | $ | 589.6 | |||||||||
(1)
Includes Index, Structured and Asset Allocation services.
www.alliancebernstein.com
9 of
10
ALLIANCEBERNSTEIN L.P.
ASSETS
UNDER MANAGEMENT
($
billions)
|
Three Month Period
|
Twelve Month Period
|
|||||||||||||||
|
09/30/08
|
9/30/2007(1)
|
09/30/08
|
9/30/2007(1)
|
|||||||||||||
|
Ending
Assets Under Management
|
$ | 589.6 | $ | 813.3 | $ | 589.6 | $ | 813.3 | ||||||||
|
Average
Assets Under Management
|
$ | 669.2 | $ | 794.1 | $ | 746.7 | $ | 745.2 | ||||||||
(1) Prior
period AUM has been adjusted to reflect client assets associated with existing
services previously not included.
ALLIANCEBERNSTEIN L.P.
ASSETS
UNDER MANAGEMENT
BY
CLIENT DOMICILE
AT
SEPTEMBER 30, 2008
($
billions)
|
Institutional Investments
|
Retail
|
Private Client
|
Total
|
|||||||||||||
|
U.
S. Clients
|
$ | 177.4 | $ | 97.7 | $ | 82.5 | $ | 357.6 | ||||||||
|
Non-U.S.
Clients
|
201.2 | 28.1 | 2.7 | 232.0 | ||||||||||||
|
Total
|
$ | 378.6 | $ | 125.8 | $ | 85.2 | $ | 589.6 | ||||||||
www.alliancebernstein.com
10 of
10
EXHIBIT 99.02

AllianceBernstein
Third
Quarter 2008 Review
Third
Quarter 2008 Review
Gerald
M. Lieberman
President & Chief Operating Officer
President & Chief Operating Officer
Lewis
A. Sanders
Chairman & Chief Executive Officer
Chairman & Chief Executive Officer
Any
forecasts in this material may not be realized. Information or opinions should
not be construed as investment advice.
October
22, 2008

AllianceBernstein
2
Third
Quarter 2008 Review
Proprietary - For
AllianceBernstein L.P. use only
Cautions
regarding Forward-Looking Statements
Certain
statements provided by management in this presentation are “forward-looking
statements” within the meaning of the Private Securities
Litigation Reform Act of 1995. Such forward-looking statements are subject to risks, uncertainties, and other factors that could cause actual results
to differ materially from future results expressed or implied by such forward-looking statements. The most significant of these factors include, but
are not limited to, the following: the performance of financial markets, the investment performance of sponsored investment products and
separately managed accounts, general economic conditions, future acquisitions, competitive conditions, and government regulations, including
changes in tax regulations and rates and the manner in which the earnings of publicly traded partnerships are taxed. We caution readers to
carefully consider such factors. Further, such forward-looking statements speak only as of the date on which such statements are made; we
undertake no obligation to update any forward-looking statements to reflect events or circumstances after the date of such statements. For further
information regarding these forward-looking statements and the factors that could cause actual results to differ, see “Risk Factors” in Part I, Item
1A of our Form 10-K for the year ended December 31, 2007 and Part II, Item 1A of our Form 10-Q for the quarter ended June 30, 2008. Any or all
of the forward-looking statements that we make in this presentation, Form 10-K, Form 10-Q, other documents we file with or furnish to the SEC, or
any other public statements we issue, may turn out to be wrong. It is important to remember that other factors besides those listed in “Risk Factors”
and those listed above and below could also adversely affect our revenues, financial condition, results of operations, and business prospects.
The
forward-looking statements referred to in the preceding paragraph include
statements regarding:
= Our
anticipation that the historical pattern of some of our best absolute and
relative returns following bouts of market turbulence
will repeat itself in the current episode, and our confidence that the actions we are taking will position us to take advantage of a
recovery for our clients and for the firm which history tells us will arrive sooner and be stronger than generally expected:
Historical performance is not necessarily indicative of future results or market movements. The actual performance of the capital markets
and other factors beyond our control will affect our investment success for clients and asset flows.
= Our
backlog of new institutional mandates not yet funded: Before they are
funded, institutional mandates do not represent legally
binding commitments to fund and, accordingly, the possibility exists that not all mandates will be funded in the amounts and at the times we
currently anticipate.
binding commitments to fund and, accordingly, the possibility exists that not all mandates will be funded in the amounts and at the times we
currently anticipate.
= The
firm’s solid financial foundation positioning it well to navigate through this
difficult period: Our solid financial
foundation is
dependent on our cash flow from operations, which is subject to the performance of the capital markets and other factors beyond our
control.
dependent on our cash flow from operations, which is subject to the performance of the capital markets and other factors beyond our
control.
= Our
hope that we will recover an additional portion of the $56.0 million claim
processing error-related charge: Our ability to
recover
more of this cost depends on the availability of funds from the related class-action settlements fund, the amount of which is not yet known.
more of this cost depends on the availability of funds from the related class-action settlements fund, the amount of which is not yet known.
*12
months ending September 30, 2008.
Market
Performance - US
AllianceBernstein
4
Third
Quarter 2008 Review
Proprietary - For
AllianceBernstein L.P. use only
AllianceBernstein
5
Third
Quarter 2008 Review
Proprietary - For
AllianceBernstein L.P. use only
AllianceBernstein
6
Third
Quarter 2008 Review
Proprietary - For
AllianceBernstein L.P. use only
NOTE:
Percentages are calculated using AUM rounded to the nearest
million.
AllianceBernstein
7
Third
Quarter 2008 Review
Proprietary - For
AllianceBernstein L.P. use only
AllianceBernstein
8
Third
Quarter 2008 Review
Proprietary - For
AllianceBernstein L.P. use only
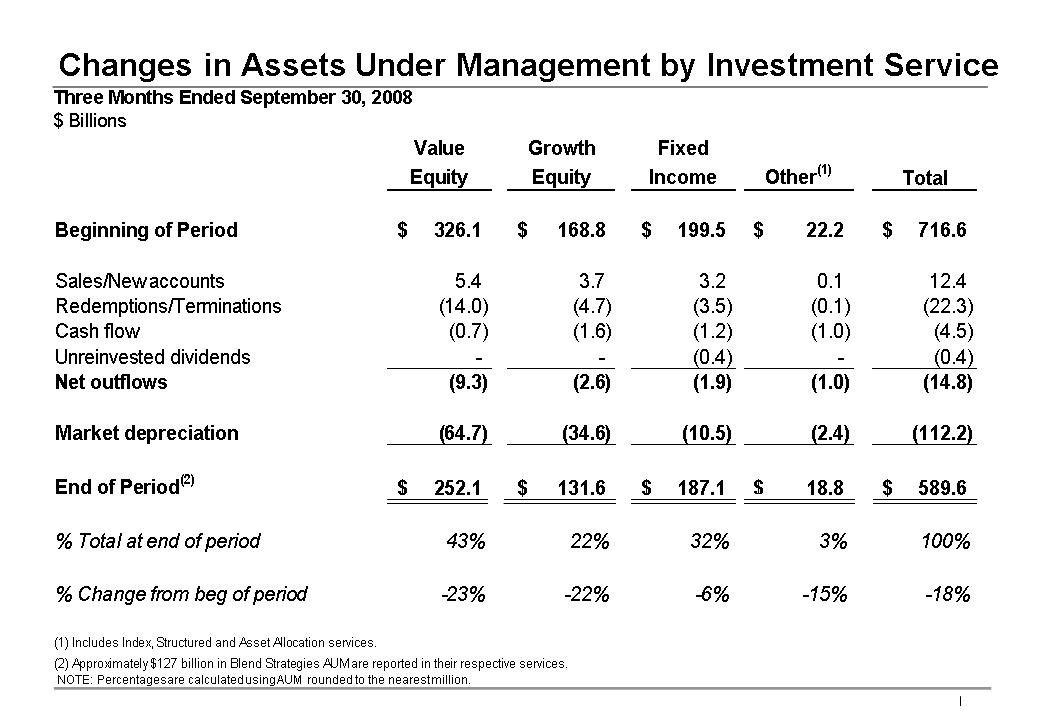
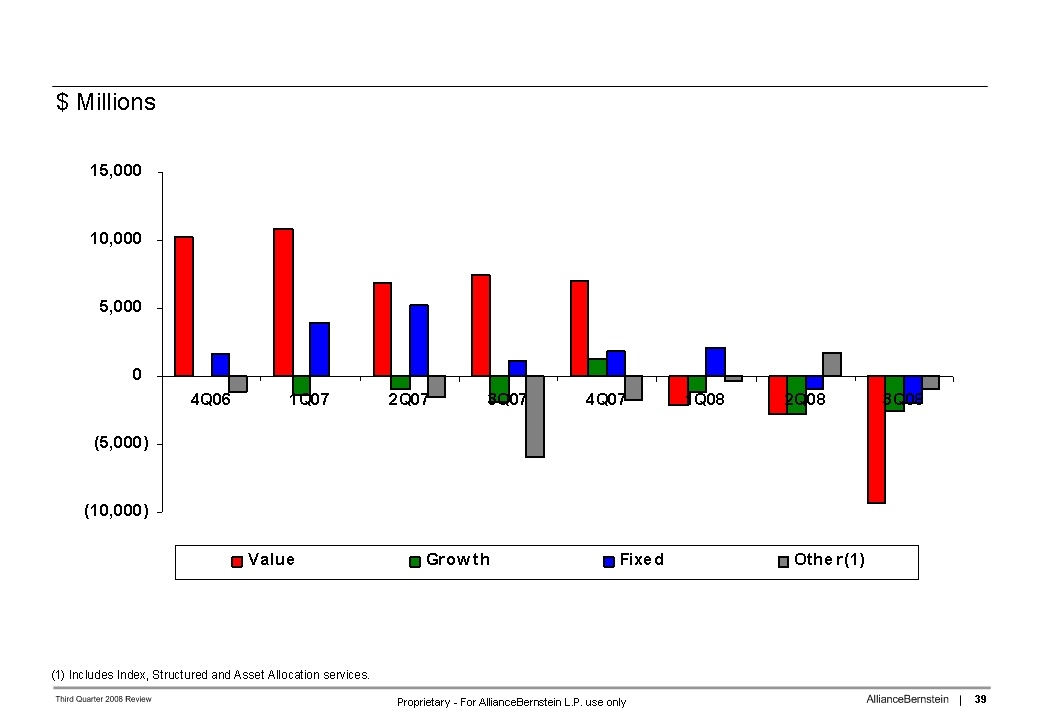
Changes
in Assets Under Management by Investment Service
AllianceBernstein
9
Third
Quarter 2008 Review
Proprietary - For
AllianceBernstein L.P. use only
(1)
Transfers of certain client accounts were made among distribution channels
resulting from changes in how these accounts are serviced by the
firm.
NOTE:
Percentages are calculated using AUM rounded to the nearest
million.
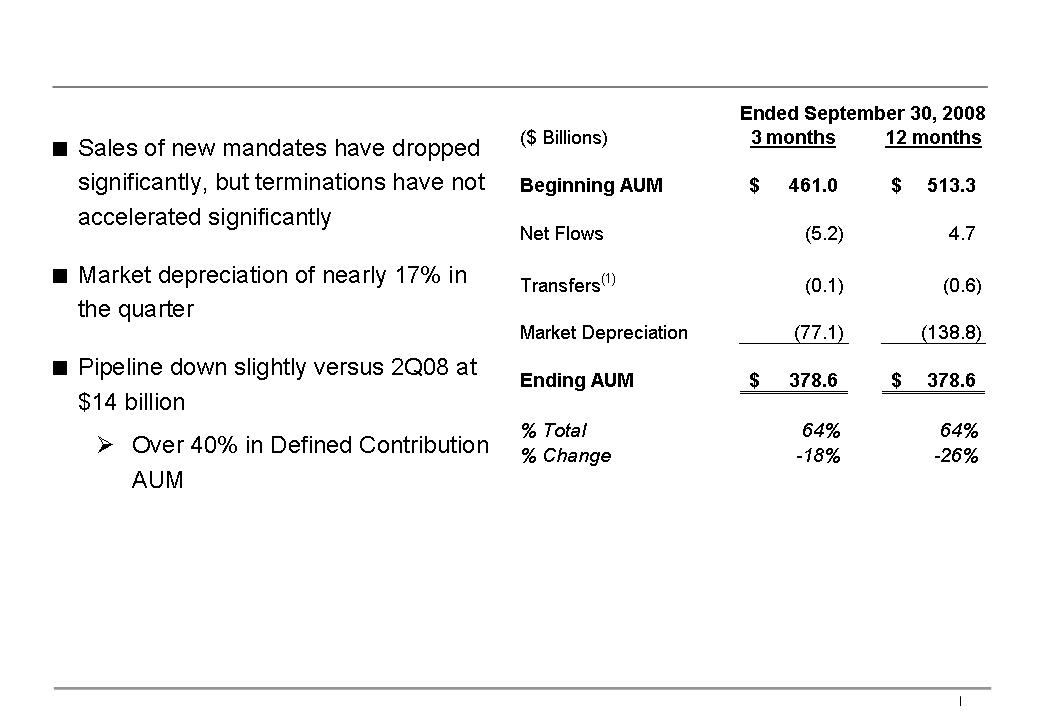
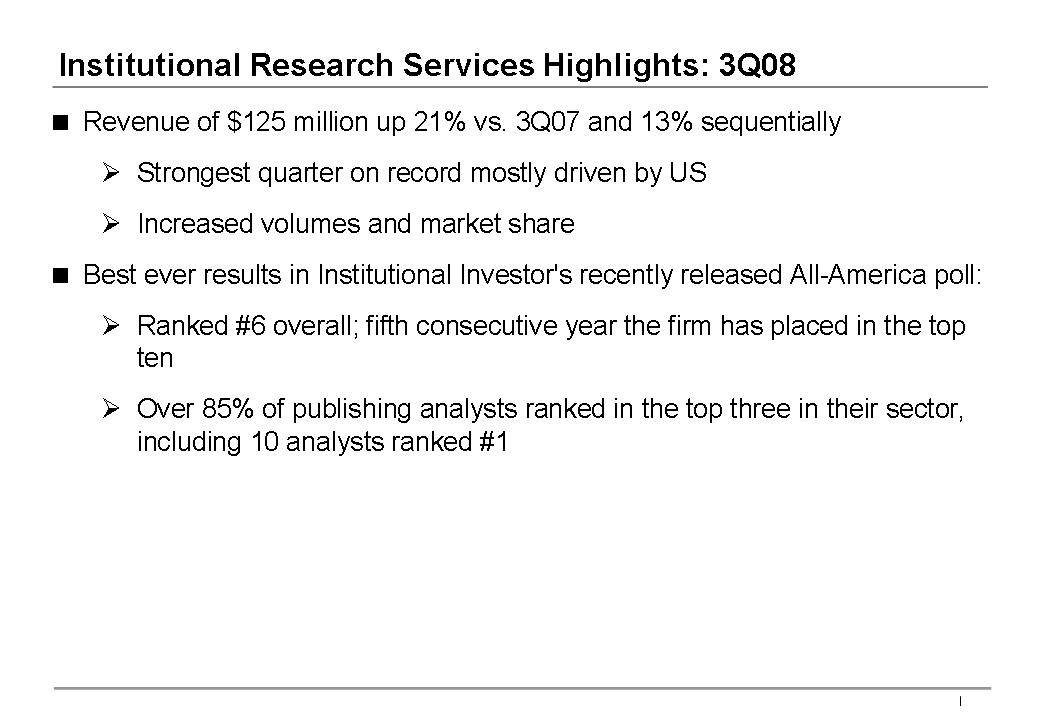
Institutional
Investments Highlights: 3Q08
AllianceBernstein
10
Third
Quarter 2008 Review
Proprietary - For
AllianceBernstein L.P. use only
(1)
Transfers of certain client accounts were made among distribution channels
resulting from changes in how these accounts are serviced by the
firm.
NOTE:
Percentages are calculated using AUM rounded to the nearest
million.
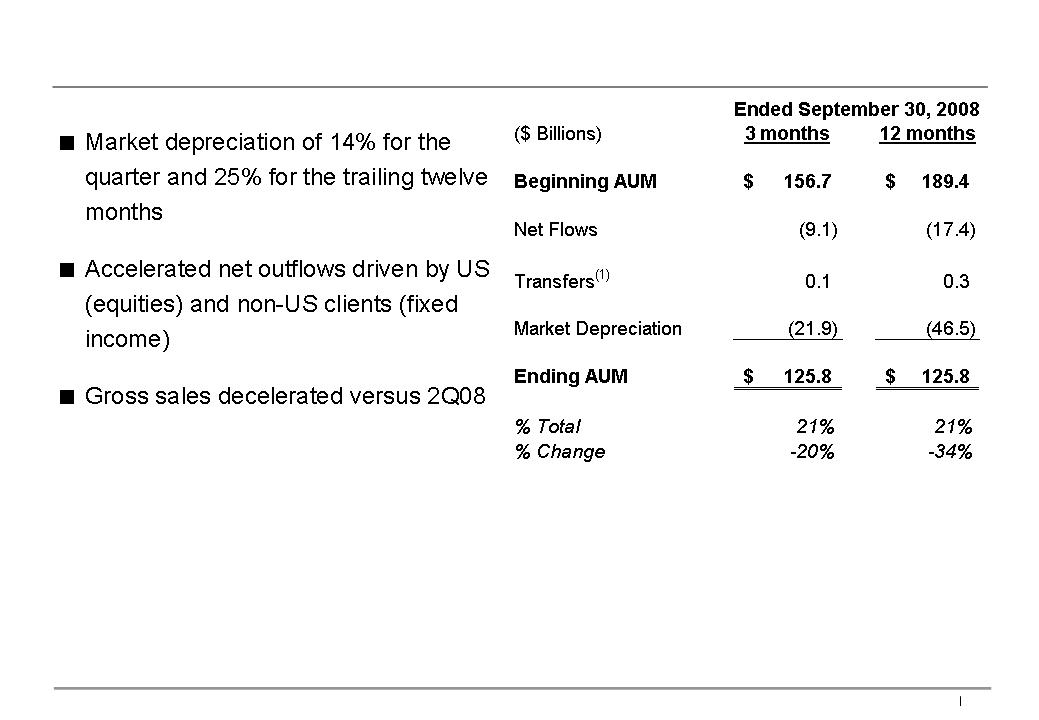
Retail
Highlights: 3Q08
AllianceBernstein
11
Third
Quarter 2008 Review
Proprietary - For
AllianceBernstein L.P. use only
(1)
Transfers of certain client accounts were made among distribution channels
resulting from changes in how these accounts are serviced by the
firm.
NOTE:
Percentages are calculated using AUM rounded to the nearest
million.
Private
Client Highlights: 3Q08
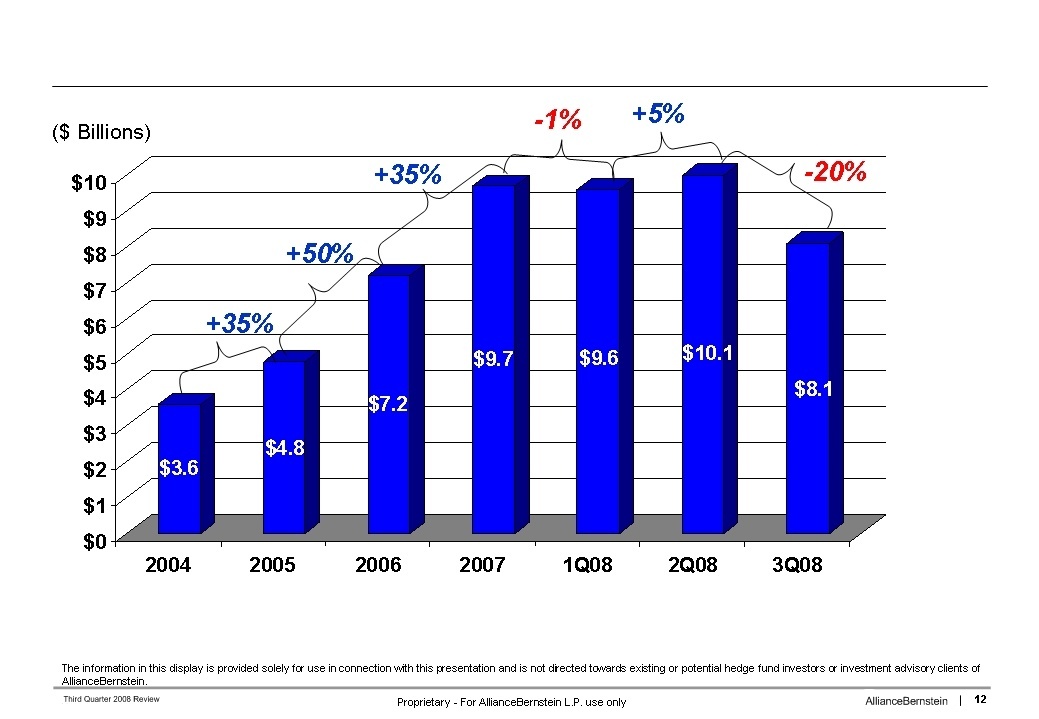
Alternative
Investment Services AUM*
*
Consists of Hedge Fund, Currency and Venture Capital
services
AllianceBernstein
13
Third
Quarter 2008 Review
Proprietary - For
AllianceBernstein L.P. use only
AllianceBernstein
14
Third
Quarter 2008 Review
Proprietary - For
AllianceBernstein L.P. use only
AllianceBernstein
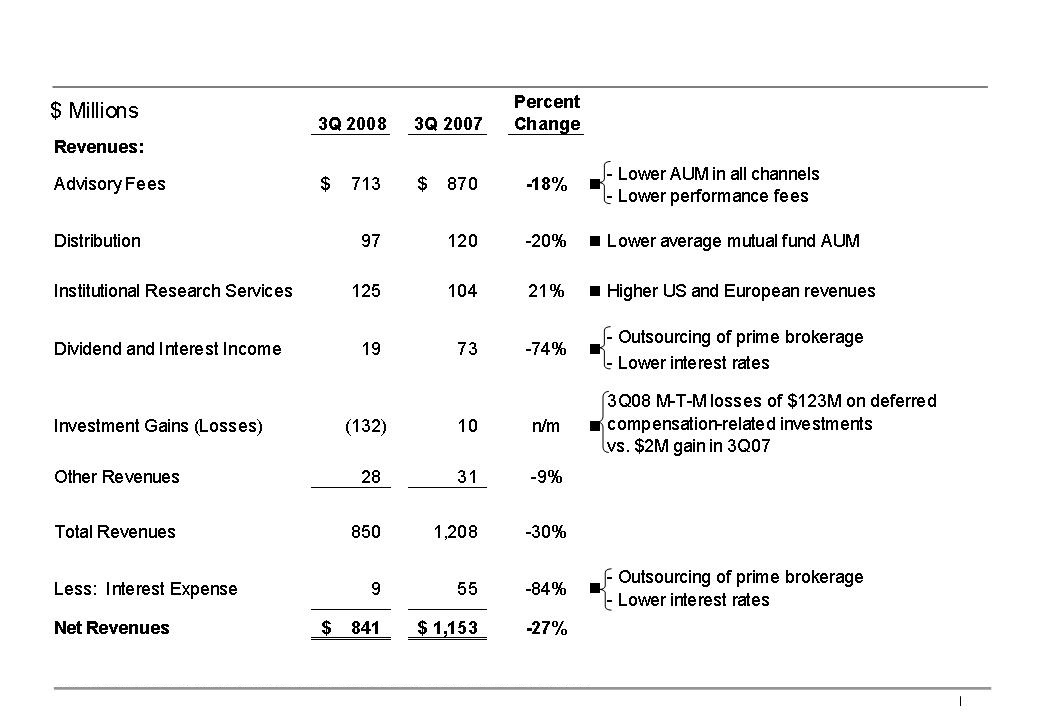
Third Quarter 2008 Revenues
NOTE: Percentages
are calculated using revenues and expenses rounded to the nearest
thousand.
AllianceBernstein
15
Third
Quarter 2008 Review
Proprietary - For
AllianceBernstein L.P. use only
AllianceBernstein
Third Quarter 2008
Advisory Fees
NOTE: Percentages
are calculated using AUM rounded to the nearest million and revenues to the
nearest thousand.
AllianceBernstein
16
Third
Quarter 2008 Review
Proprietary - For
AllianceBernstein L.P. use only
AllianceBernstein
Third Quarter 2008
Operating Expenses
NOTE: Percentages
are calculated using revenues and expenses rounded to the nearest
thousand.
AllianceBernstein
17
Third
Quarter 2008 Review
Proprietary - For
AllianceBernstein L.P. use only
NOTE:
Percentages are calculated using expenses rounded to the nearest
thousand.
AllianceBernstein
Third Quarter 2008 Compensation
& Benefits
AllianceBernstein
18
Third
Quarter 2008 Review
Proprietary - For
AllianceBernstein L.P. use only
AllianceBernstein
Third Quarter 2008 Net Income
(1)
"Operating Margin" = (Operating Income - Non-Controlling Interest in
Earnings)/Net Revenues
NOTE: Percentages
are calculated using revenues and expenses rounded to the nearest
thousand.
AllianceBernstein
19
Third
Quarter 2008 Review
Proprietary - For
AllianceBernstein L.P. use only
(1)
Excludes insurance recoveries related to class action claims processing
error.
NOTE:
Percentages are calculated using income, earnings and expenses rounded to the
nearest thousand.
AllianceBernstein
Holding Financial Results

AllianceBernstein
Third
Quarter 2008 Review
Third
Quarter 2008 Review
Lewis
A. Sanders
Chairman & Chief Executive Officer
Chairman & Chief Executive Officer
Any
forecasts in this material may not be realized. Information or opinions should
not be construed as investment advice.
October
22, 2008


AllianceBernstein
23
Third
Quarter 2008 Review
Proprietary - For
AllianceBernstein L.P. use only
Market
Environment
AllianceBernstein
24
Third
Quarter 2008 Review
Proprietary - For
AllianceBernstein L.P. use only
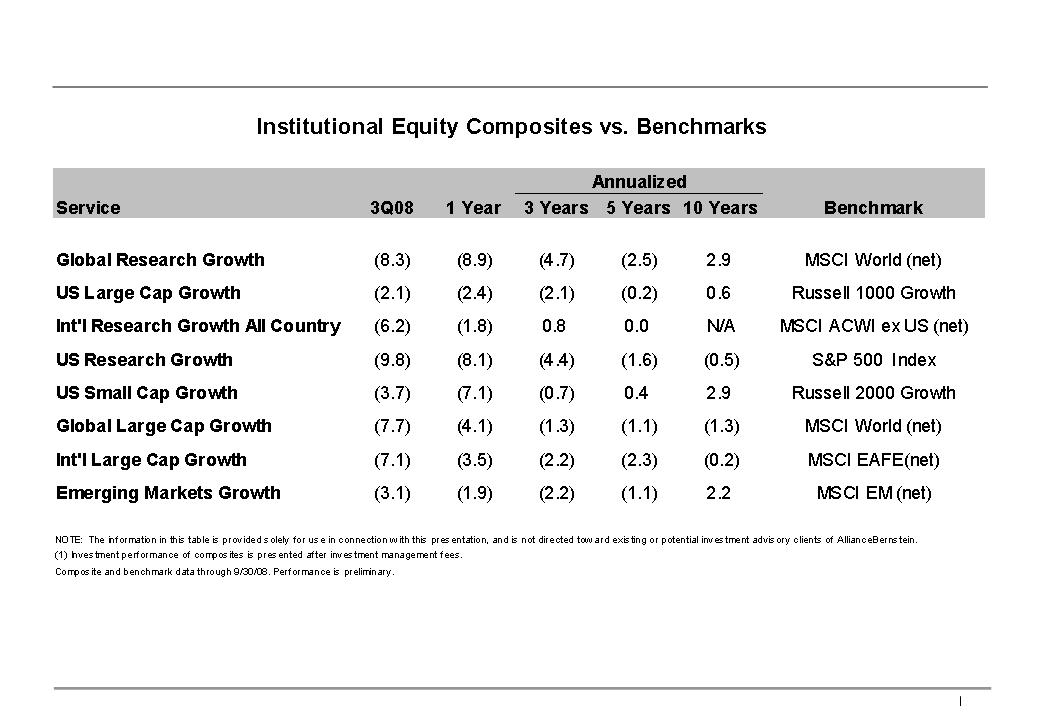
Relative
Performance: Institutional Growth Equity (After
Fees)(1)
AllianceBernstein
25
Third
Quarter 2008 Review
Proprietary - For
AllianceBernstein L.P. use only
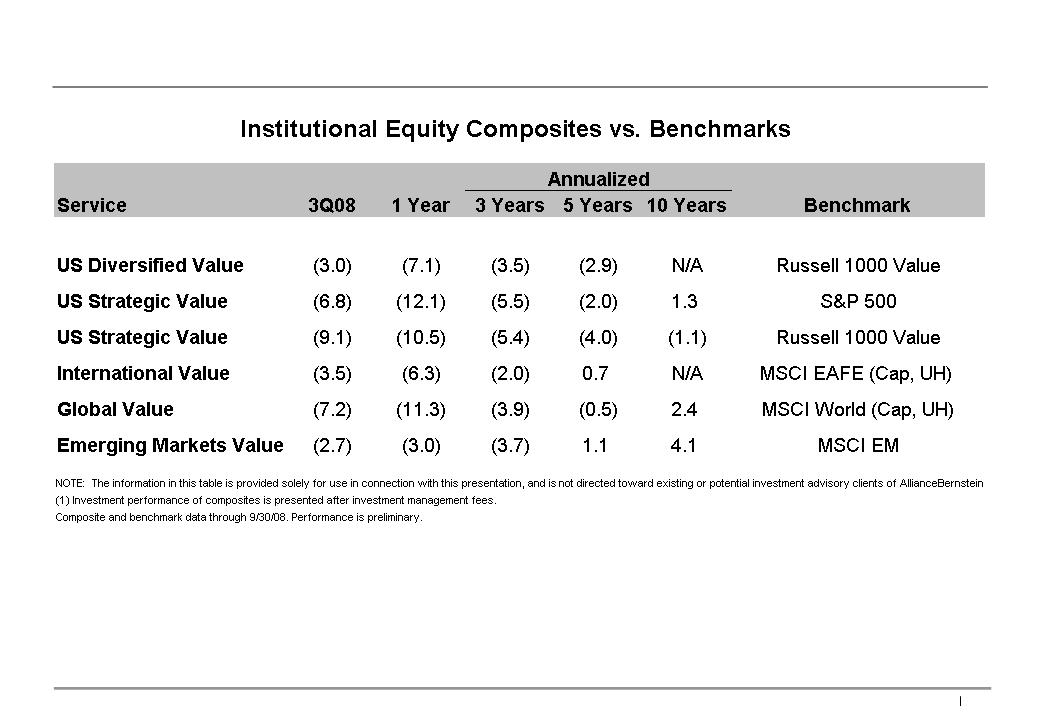
Relative
Performance: Institutional Value Equity (After
Fees)(1)
AllianceBernstein
26
Third
Quarter 2008 Review
Proprietary - For
AllianceBernstein L.P. use only
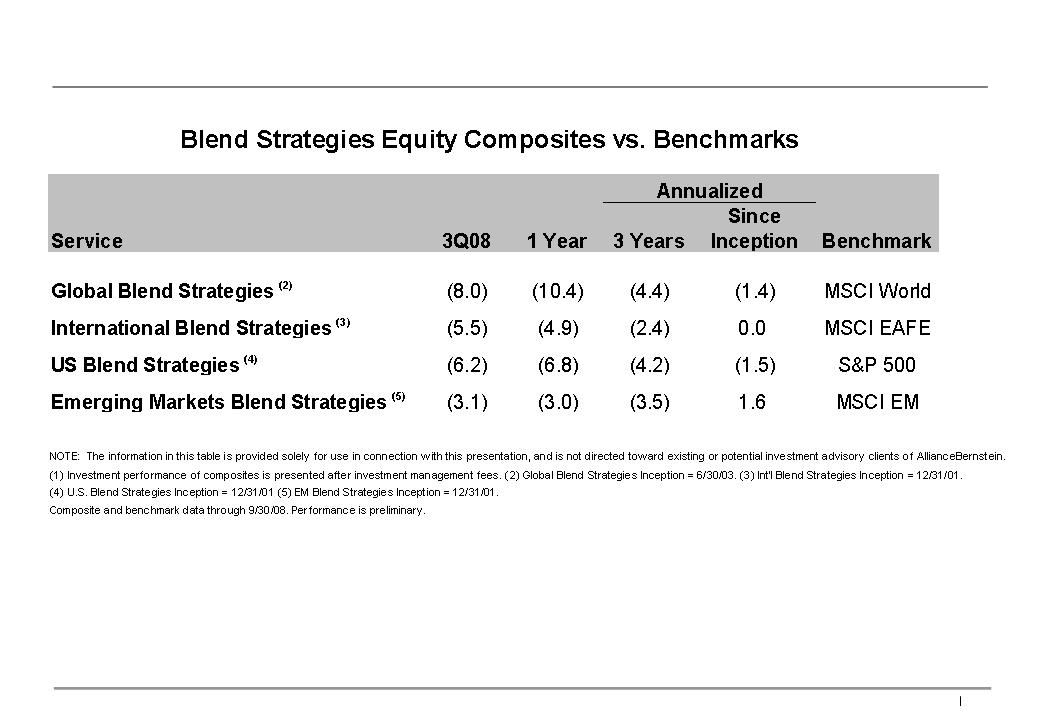
Relative
Performance: Blend Strategies (After
Fees)(1)
AllianceBernstein
27
Third
Quarter 2008 Review
Proprietary - For
AllianceBernstein L.P. use only
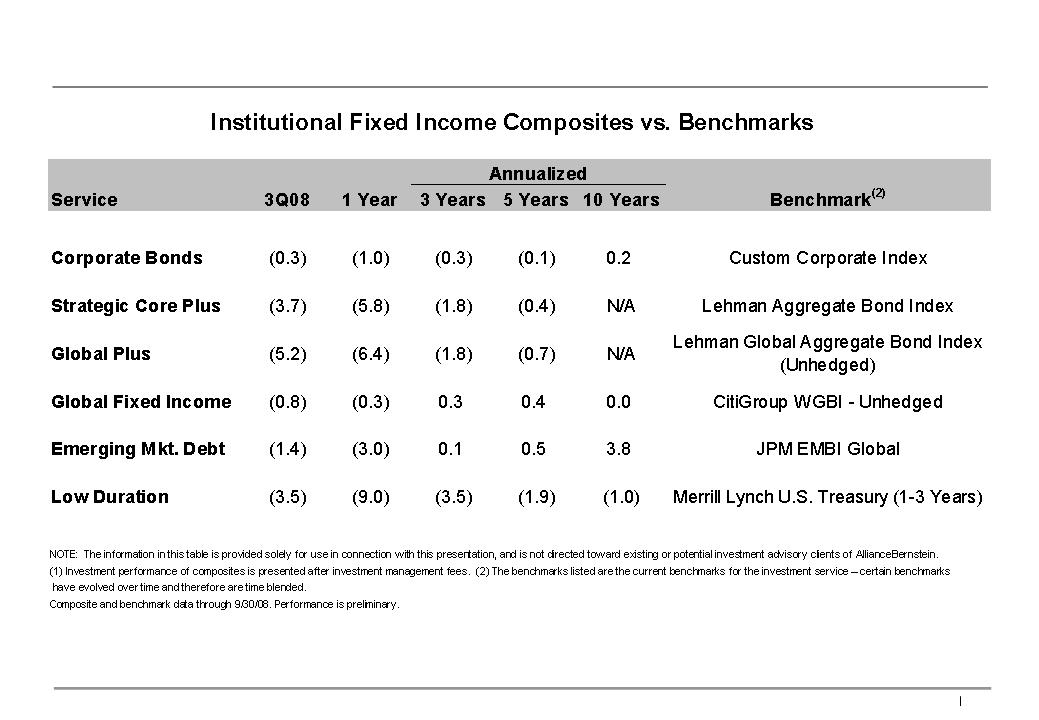
Relative
Performance: Institutional Fixed Income (After
Fees)(1)
AllianceBernstein
28
Third
Quarter 2008 Review
Proprietary - For
AllianceBernstein L.P. use only
Absolute
Performance: Private
Client
(After
Fees)(1)
AllianceBernstein
29
Third
Quarter 2008 Review
Proprietary - For
AllianceBernstein L.P. use only
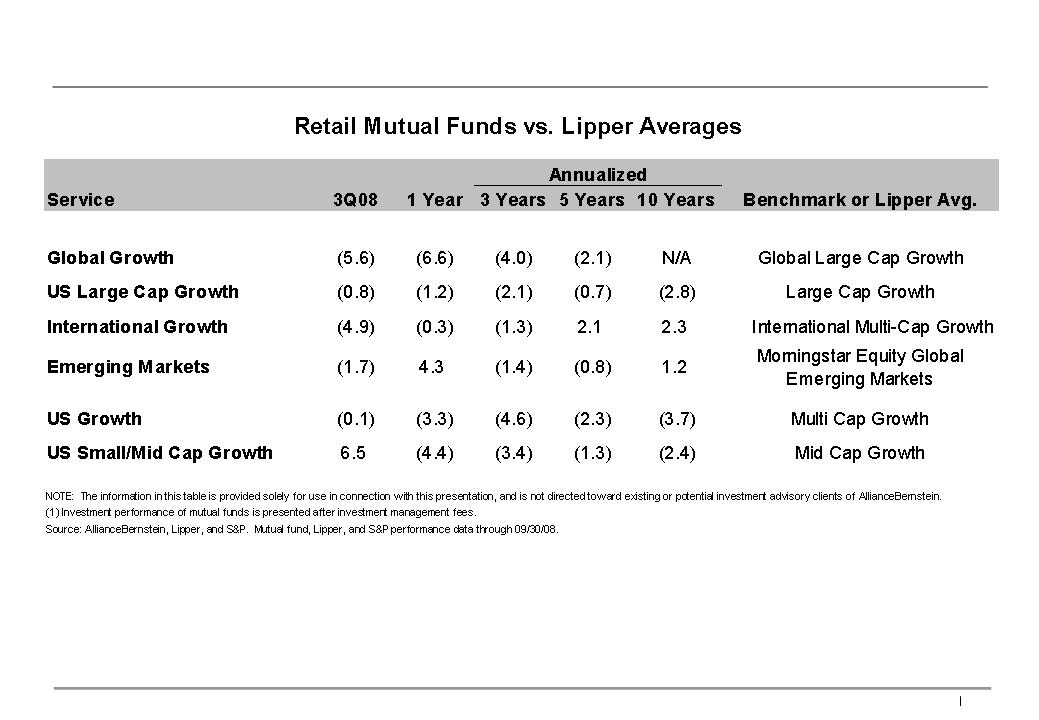
Relative
Performance: Retail Growth Equity (After
Fees)(1)
AllianceBernstein
30
Third
Quarter 2008 Review
Proprietary - For
AllianceBernstein L.P. use only
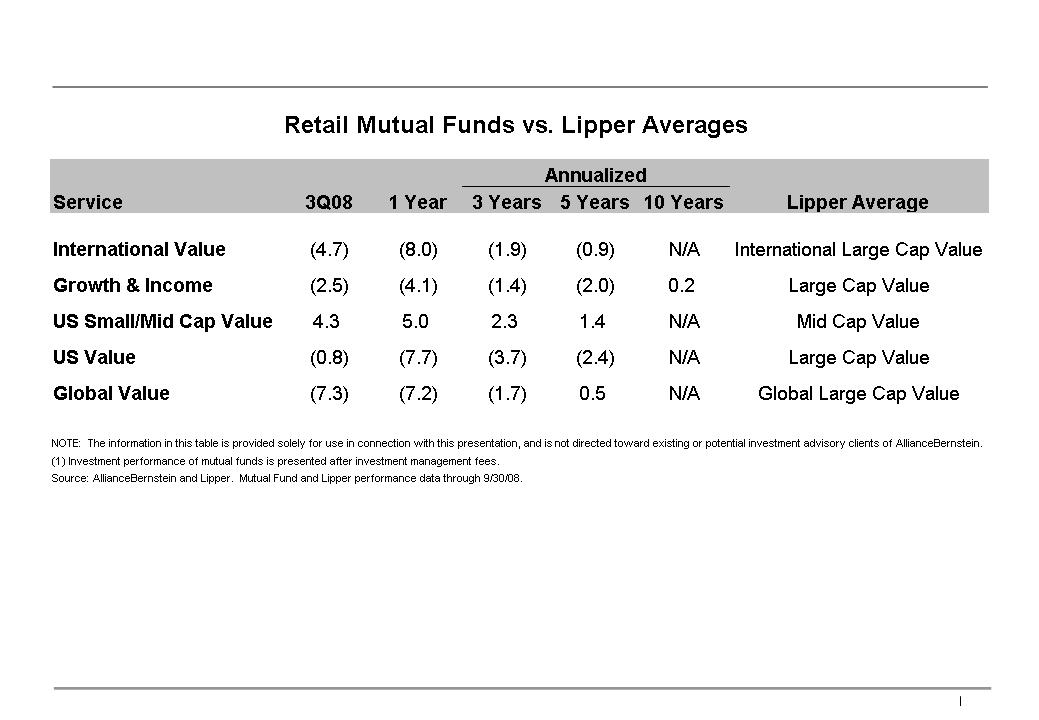
Relative
Performance: Retail Value Equity (After
Fees)(1)
AllianceBernstein
31
Third
Quarter 2008 Review
Proprietary - For
AllianceBernstein L.P. use only
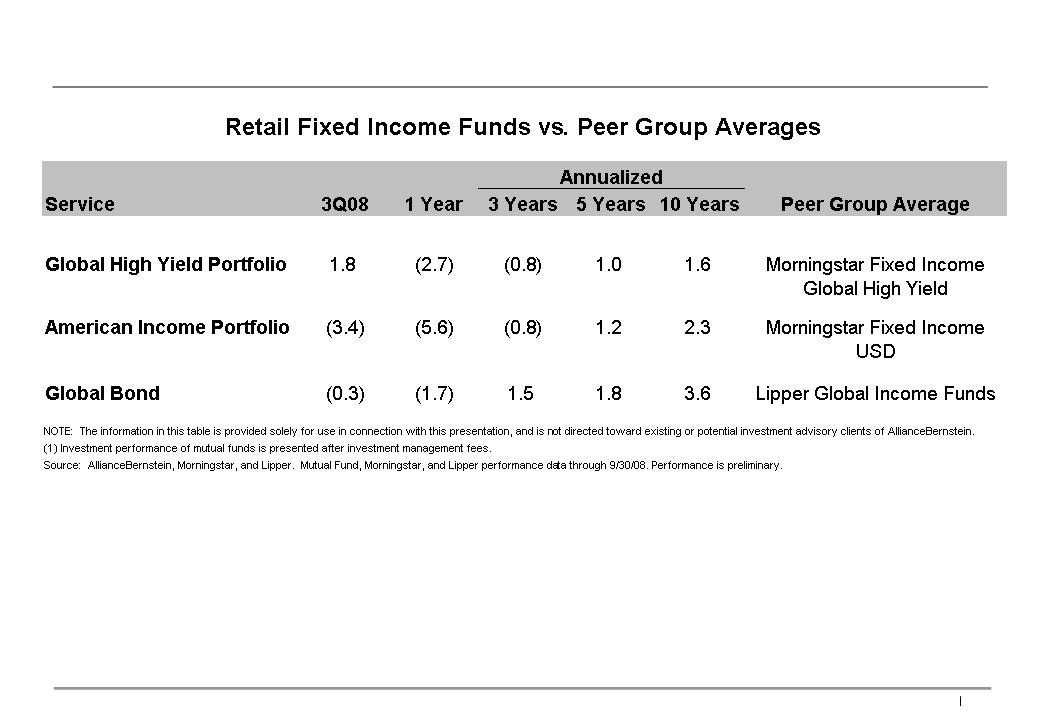
Relative
Performance: Retail Fixed Income (After
Fees)(1)
AllianceBernstein
32
Third
Quarter 2008 Review
Proprietary - For
AllianceBernstein L.P. use only
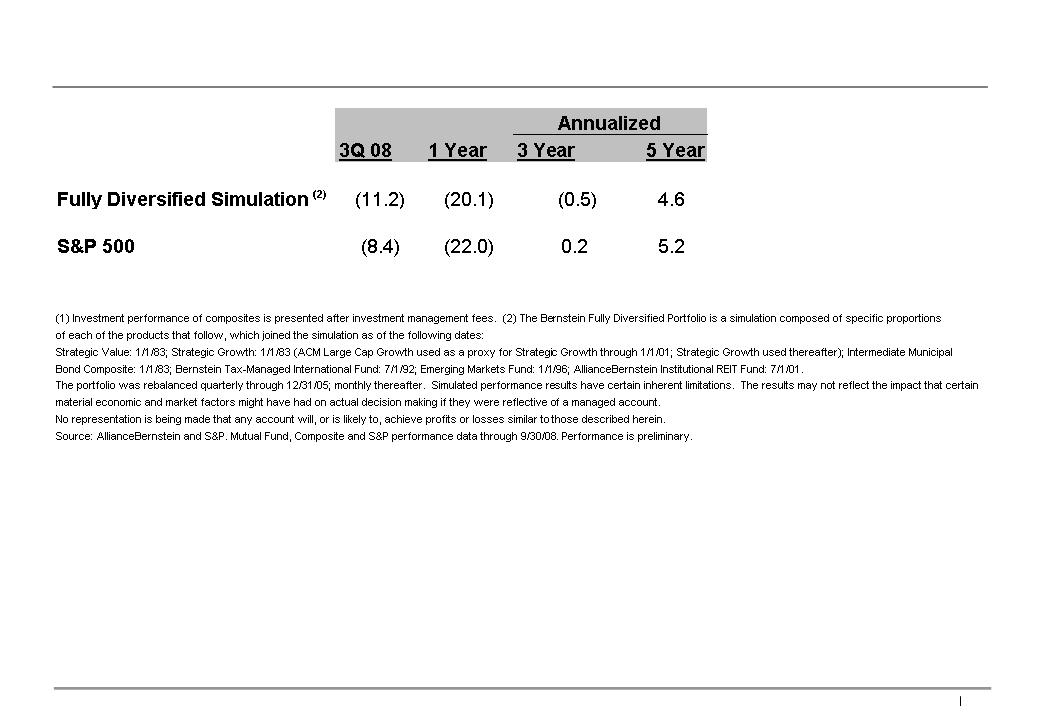
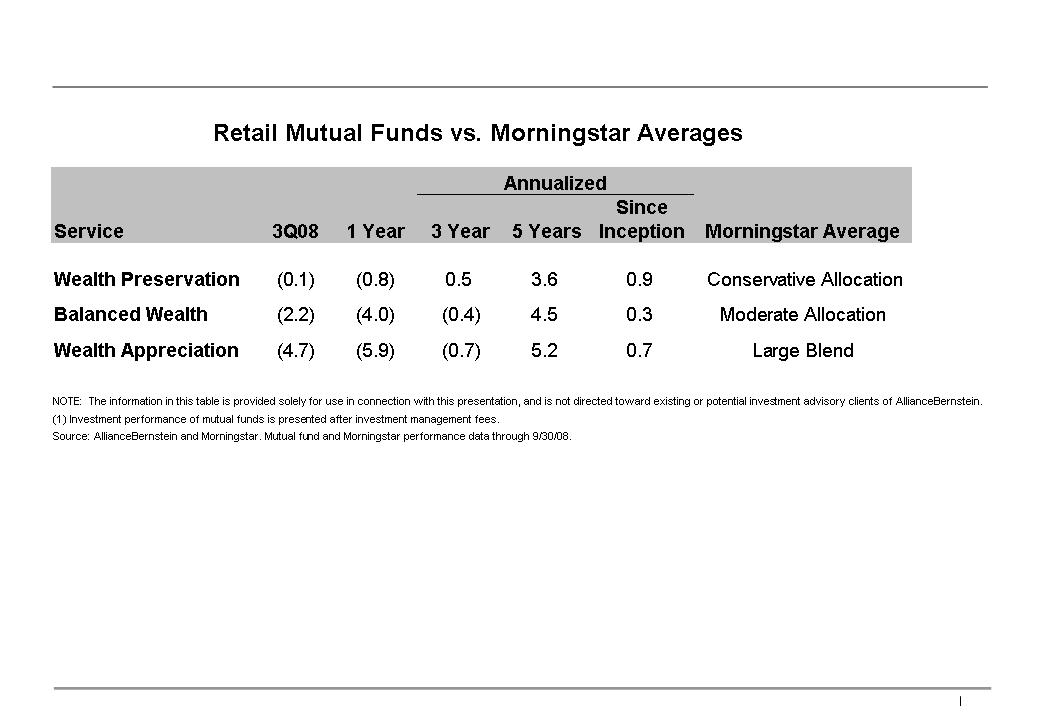
Relative
Performance: Wealth Strategies (After
Fees)(1)
AllianceBernstein
34
Third
Quarter 2008 Review
Proprietary - For
AllianceBernstein L.P. use only
AllianceBernstein
35
Third
Quarter 2008 Review
Proprietary - For
AllianceBernstein L.P. use only
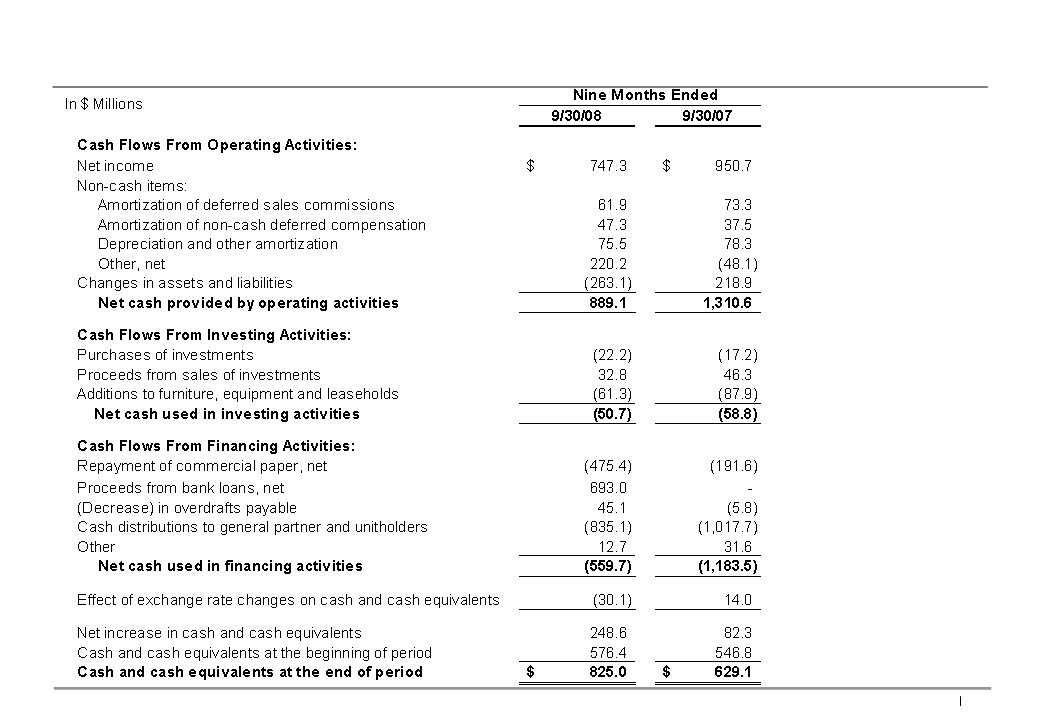
AllianceBernstein
Consolidated Statement of Cash Flows

AllianceBernstein
36
Third
Quarter 2008 Review
Proprietary - For
AllianceBernstein L.P. use only
AllianceBernstein
Headcount

AllianceBernstein
Total Net Flows
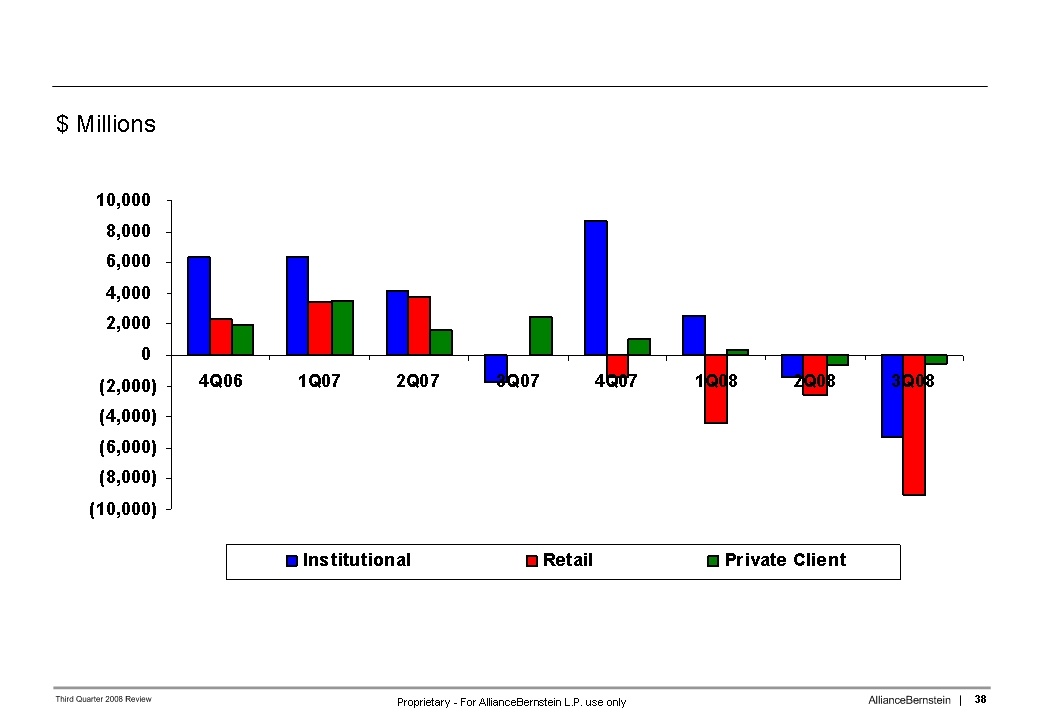
AllianceBernstein
Net Flows by Distribution Channel

AllianceBernstein®
and the AB AllianceBernstein Logo are trademarks and service marks owned by
AllianceBernstein L.P.
Exhibit
99.03
Event
ID: 1994062
Culture: en-US
Event
Name: Q3 2008 AllianceBernstein Holding L.P. Earnings Conference
Call
Event
Date: 2008-10-22T21:00:00 UTC
P:
Operator;
C: Philip
Talamo; AllianceBernstein Holding L.P.; Director, IR
C: Jerry
Lieberman; AllianceBernstein Holding L.P.; President and COO
C: Lew
Sanders; AllianceBernstein Holding L.P.; Chairman and CEO
P: Craig
Siegenthaler; CSFB; Analyst
C: Robert
Joseph; AllianceBernstein Holding L.P.; SVP and CFO
P: Marc
Irizarry; Goldman Sachs; Analyst
P:
Cynthia Mayer; Merrill Lynch; Analyst
P: Robert
Lee; Keefe, Bruyette & Woods; Analyst
P:
William Katz; Buckingham Research Group; Analyst
P:
Christopher Spahr; Deutsche Bank; Analyst
Operator: Thank you for
standing by, and welcome to the AllianceBernstein third quarter 2008 earnings
review. At this time, all participants are in a listen-only mode. As a reminder,
this conference is being recorded, and will be replayed for one week. I would
now like to turn the conference over to the host for this call, the Director of
Investor Relations for AllianceBernstein, Mr. Philip Talamo. Please go
ahead.
Philip Talamo: Thank you Sade.
Good afternoon, everyone, and welcome to our third quarter 2008 earnings review.
As a reminder, this conference call is being webcast, and is supported by a
slide presentation that can be found in the Investor Relations section of our
website at www.alliancebernstein.com/investorrelations.
Presenting our results today is our President and Chief Operating Officer, Jerry
Lieberman. Following Jerry's remarks, our Chairman and CEO, Lew Sanders, will
briefly address the audience. Our CFO Bob Joseph will also be available to
answer questions after our formal remarks.
I would
like to take this opportunity to note that some of the information we present
today is forward-looking in nature, and, as such, is subject to certain SEC
rules and regulations regarding disclosure. Our disclosure regarding
forward-looking statements can be found on page 2 of our presentation, as well
as in the Risk Factors section of our 2007 10-K. In light of the SEC's
Regulation FD, management is limited in responding to inquiries from investors
and analysts in a non-public forum. Therefore, we encourage you to ask all
questions of a material nature on this call. Now, I'll turn the call over to
Jerry.
Jerry Lieberman: Thank you,
Phil and good afternoon to everyone on the call. It's obvious to all that we're
going through terribly turbulent capital markets and that these conditions have
had a sharply negative impact on our absolute performance for our clients, and
indeed, on our financial results for our unitholders. For the second quarter in
a row, assets under management, revenues, net income and distributions, as well
as expenses, are all down versus the corresponding quarter of 2007, trends that
must be and are being addressed.
Additionally,
our relative performances suffered significantly, impacted by our exposure to
sectors and individual stock selection most adversely affected by the global
financial crisis, as well as our significant non-U.S. exposure during a period
of a strengthening U.S. dollar.
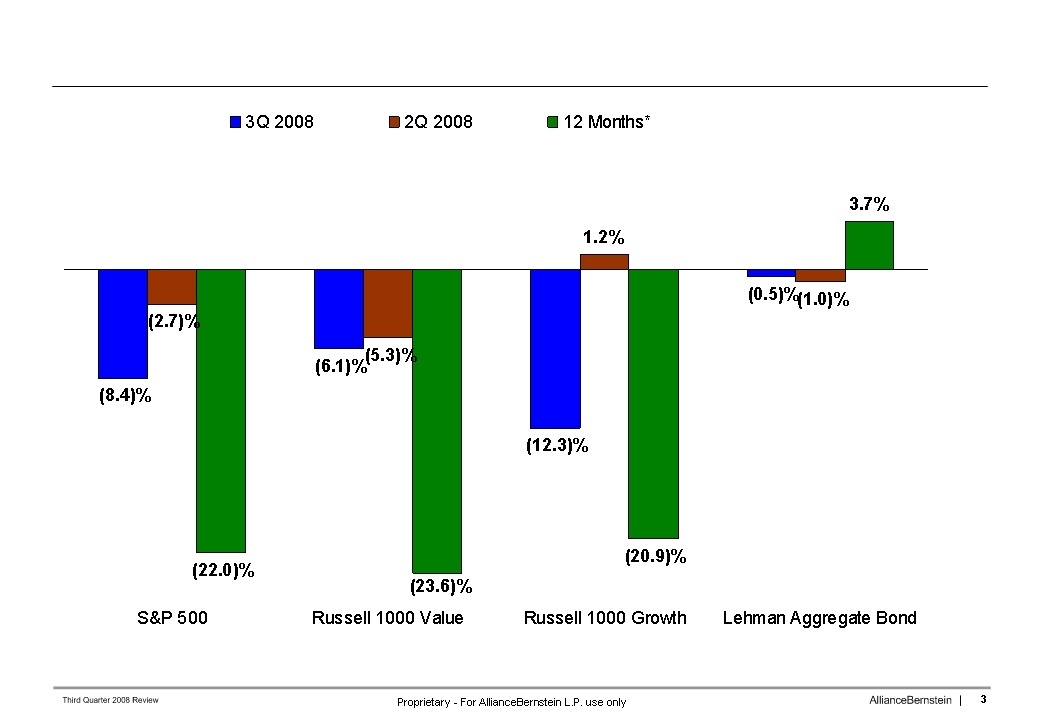
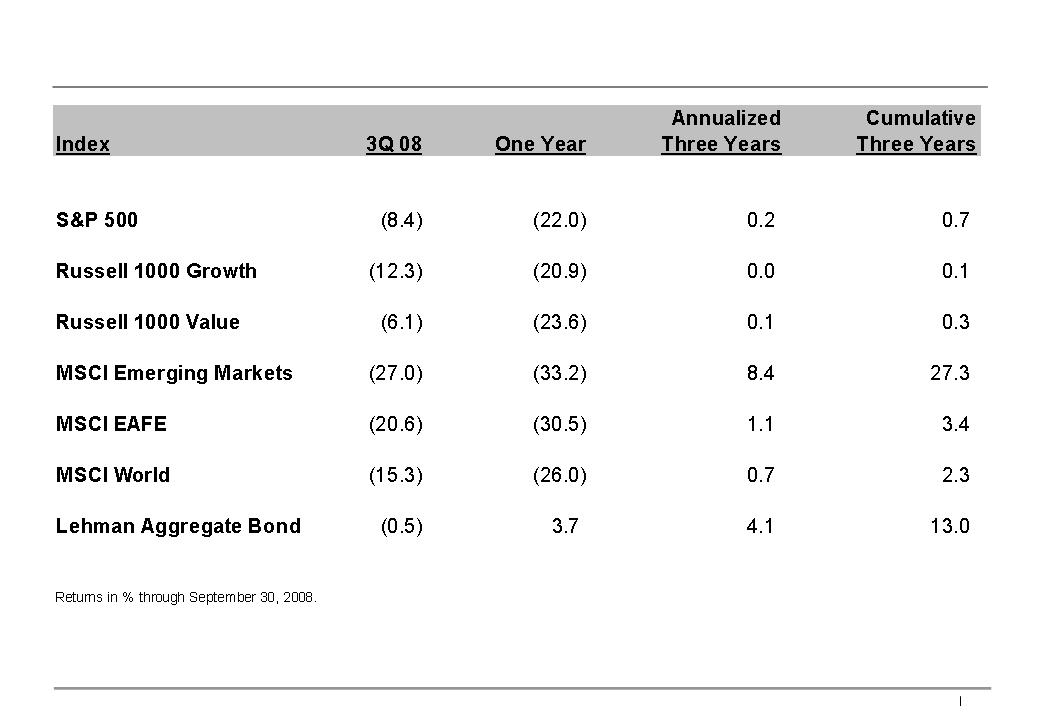
As far as
the capital markets are concerned, U.S. equity indices, shown on Display 3, were
down 8.4% to 12.3% for the quarter, and 20.9% to 23.6% for the 12 months ended
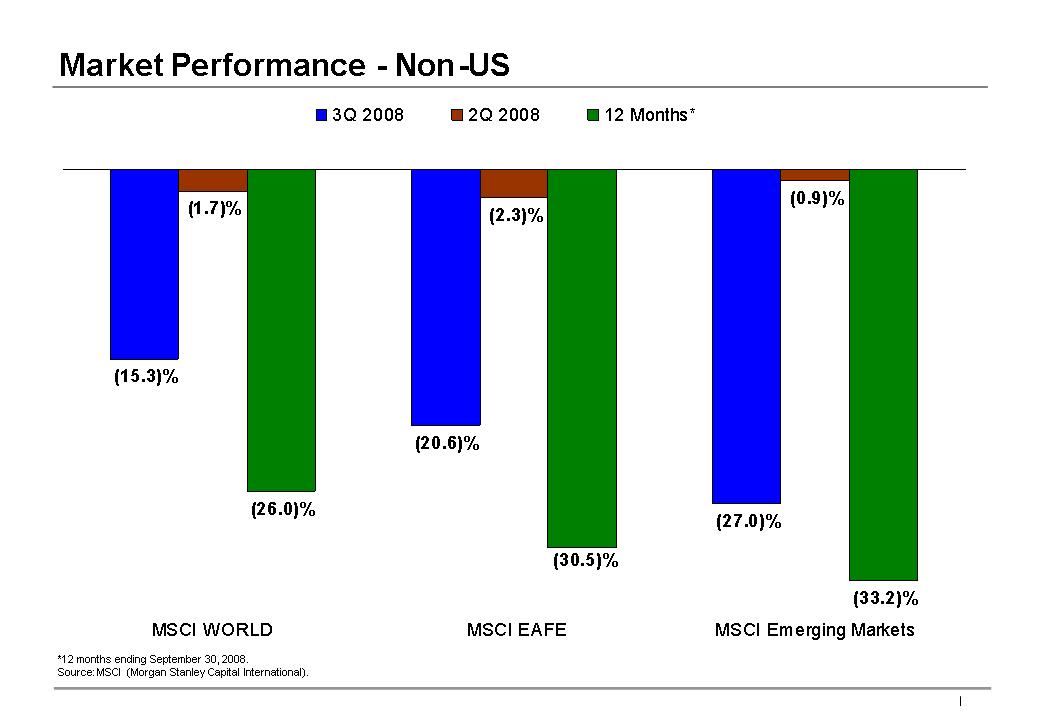
September. Non-U.S market indices, shown on Display 4, declined dramatically
from 15.3% to 27% for the quarter, and from 26% to over 33% over the last 12
months.
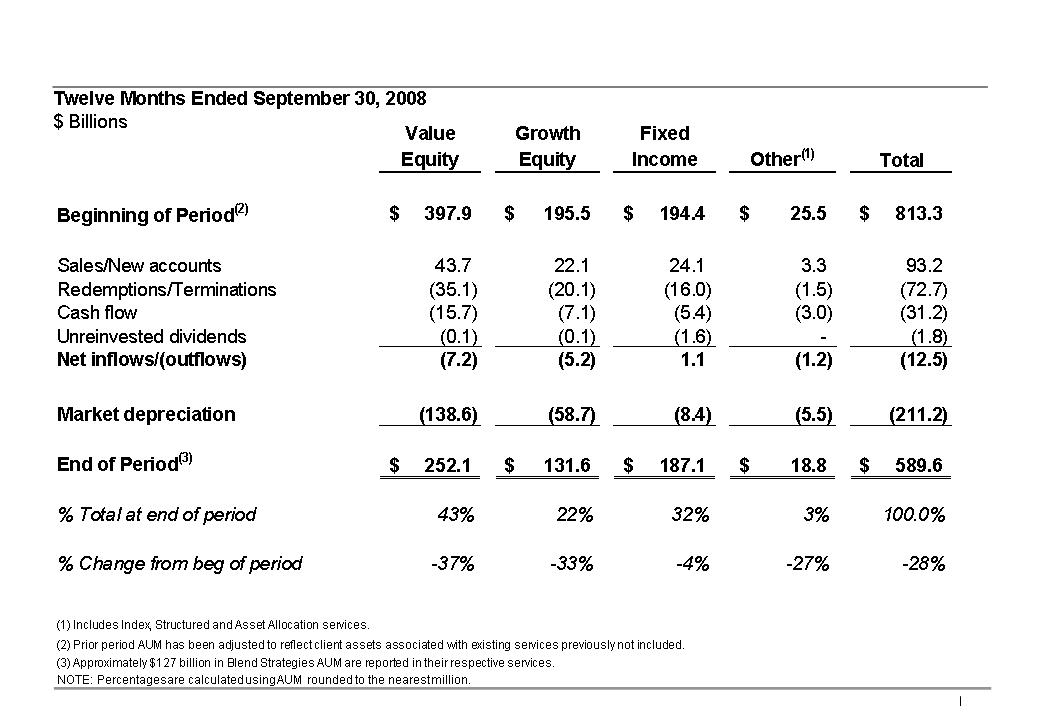
Displays
5-8 reflect our assets under management roll-forwards by channel and by major
asset class for both the quarter and the trailing 12 months. These displays show
that our assets have declined by $127 billion and $224 billion for the quarter
and trailing 12 months, respectively, overwhelmingly due to the market
depreciation in both Value and Growth equities.
Now,
let's turn to Display 9, where I'll begin my discussion on channel highlights.
In our Institutional Investment distribution channel, AUM declined by 18% in the
quarter, almost entirely due to market depreciation. It is important to note
that although our net outflows accelerated versus the previous quarter to $5.2
billion, these outflows are more a function of fewer new mandates, rather than a
significant loss of client accounts or cash flow withdrawals. Aside from the
defined contribution plan mandate wins, we are seeing institutional investors
put new mandates on hold while the market turmoil plays itself out. Accordingly,
our pipeline of won but unfunded Institutional mandates declined slightly to $14
billion, with over 40% in defined contribution AUM, a key strategic initiative
for our firm.
On
Display 10, you can see that our Retail channel assets decreased by 20% for the
quarter, due primarily to market depreciation of 14%. However, net outflows in
this channel were substantial as sales have virtually collapsed and redemptions
have indeed increased. This is a phenomenon that began in Asia but has now
spread to the U.S. Net outflows accounted for over 29% of the decline, and were
most notable in equity services for U.S. clients and fixed income services for
non-U.S. clients.
Turning
to Display 11, you'll see that our Private Client channel AUM fell by 14% during
the quarter, a smaller decline than our other channels, incurring modest net
outflows at a rate actually slightly lower than the second quarter of 2008. Even
more so than in our Institutional Investment channel, let alone our Retail
channel, our Private Client group's assets are our stickiest, that is, our most
persistent. We attribute Private Client loyalty to constant high quality client
servicing and the penetration of our asset allocation services that have served
our clients well in these tumultuous times. However, we have seen a slowing of
new account openings.
Display
12 shows that during the third quarter of 2008, the total AUM associated with
our suite of Alternative Investment Services fell by 20% sequentially to $8.1
billion. This decline in assets was predominantly due to market depreciation in
Hedge Fund services.
On a more
positive note, as cited on Display 13, Institutional Research Services
established a new record for quarterly revenue at $125 million, with increased
market volumes and increased market share each contributing to these robust
results. The 21% in year-over-year growth was mostly driven by our U.S.
operations. Also, our sell-side analysts posted excellent results in
Institutional Investor’s just released All-America poll- in fact, the best ever
for our firm. The firm as a whole placed in the top 10 for the fifth consecutive
year at number 6 and every single analyst that began 2008 as a publishing
analyst was recognized in the survey, with 85% in the top 3 in their sector,
including 10 “number ones”.
Moving to
the income statement, I'll begin with the discussion of revenues as shown on
Display 14.
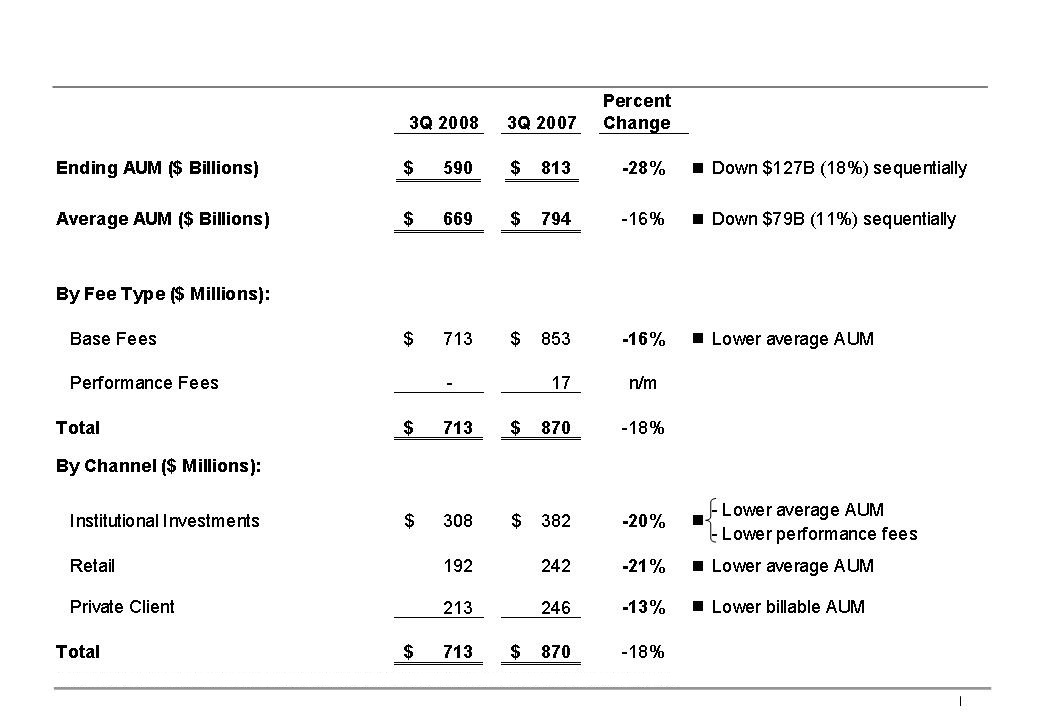
Net
revenues fell by 27% to $841 million, the first time in two years that quarterly
net revenues were below $1 billion. Over 50% of the $312 million year-over-year
revenue decline was due to an 18% decrease in Advisory Fees, as AUM fell
substantially in all three buy-side distribution channels.
About 46%
of the decline in Net Revenues was due to a $142 million swing in Investment
Gains and Losses, principally the result of mark-to-market losses on investments
related to deferred compensation of $123 million, compared to $2 million in
gains for the third quarter of 2007. As a reminder, these mark-to-market gains
and losses have a corresponding offset in current and future incentive
compensation expense.
The sharp
percentage decline in Distribution revenues was due to lower Retail AUM. Largely
offsetting this decline was the strong increase in Institutional Research
Services revenue that I noted earlier. The substantial percentage decrease in
Dividend and Interest income, as well as the offsetting decrease in Interest
Expense below, reflect the late 2007 outsourcing of our prime brokerage
services, as well as lower interest rates.
Display
15 provides additional analysis of Advisory Fees. Lower base fees represent
almost 90% of the $157 million decline in Advisory Fees, with the lack of
performance fees making up the remainder. You will note that the decrease in
base fees was 1,200 basis points lower than the decrease in period-ending AUM,
yet equal to the decrease in average AUM. This was due to the fact
that much of the third-quarter's market depreciation occurred in September, so
the impact on average AUM for the quarter was less severe than the impact on
period-ending AUM.
All three
buy-side distribution channels incurred a double-digit decline in revenue, with
Retail and Institutional Investments down around 20%, and our Private Client
channel down about 13%, which were in line with their respective decreases in
AUM.
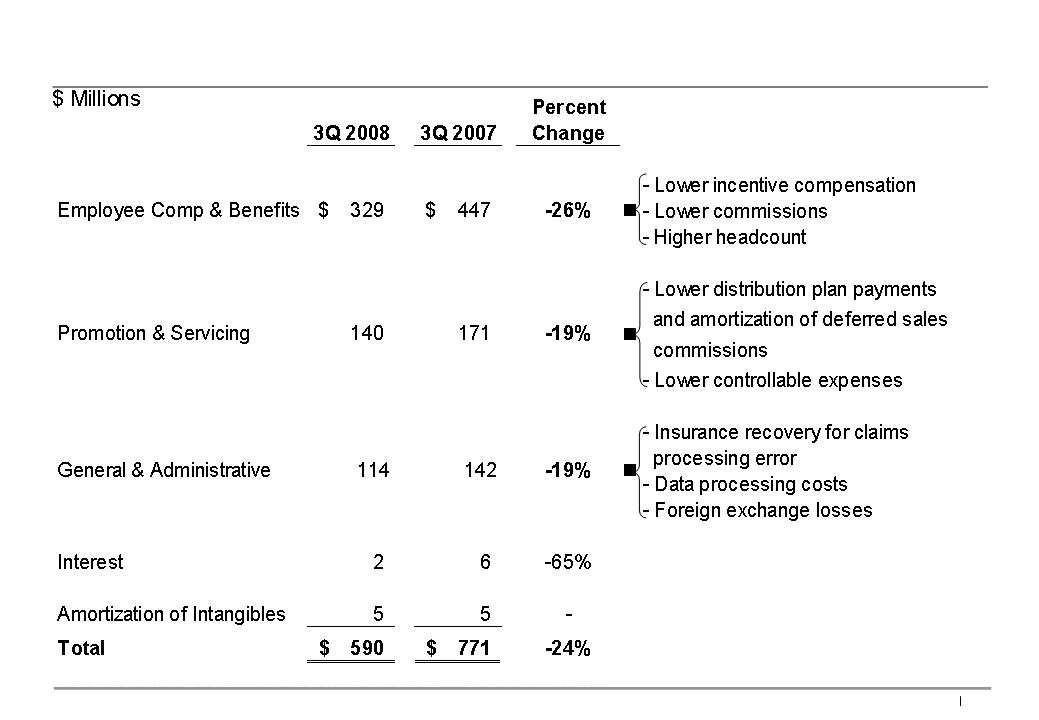
Operating
expenses, as shown on Display 16, declined by $181 million, or 24%,
year-over-year. About two-thirds of the decrease came from employee compensation
and benefits, which fell by $118 million, or 26%, and will be discussed in
greater detail on the next display.
Promotion
and Servicing expense decreased by 19%, or $31 million, in the quarter. Lower
distribution plan payments accounted for approximately one- half of this decline
and controllable expenses such as travel, printing and mailing expenses
accounted for approximately one-third, with the balance due to lower
amortization of deferred sales commissions.
General
and Administrative expenses were down 19% as a $35 million insurance recovery
related to the fourth quarter 2006 charge for a class action claims processing
error was partially offset by higher data processing costs resulting from
increased trading volumes and foreign exchange losses versus gains in the
prior-year quarter.
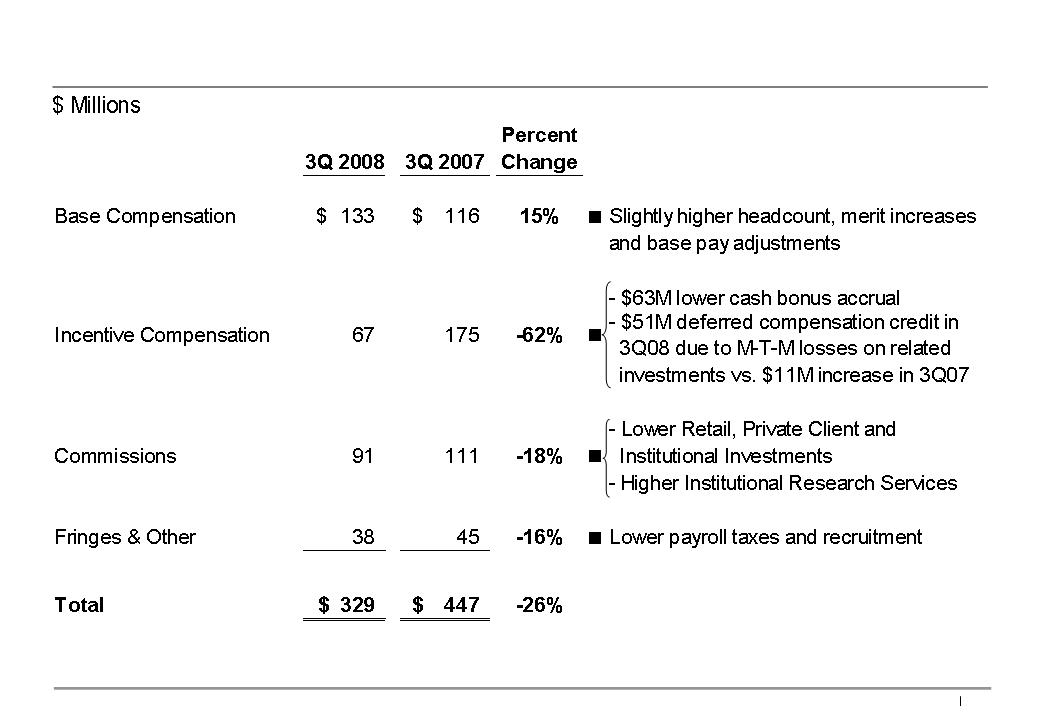
Display
17 details Employee Compensation and Benefits which fell 26% versus the third
quarter of 2007 to $329 million. Base compensation was up 15% versus last year,
due to slightly higher headcount, merit increases and base compensation
adjustments. Headcount increased versus the second quarter of 2008 by only 25
employees, to 5,660, a topic that Lew will address in more depth later on in
this call.
Third
quarter Incentive Compensation expense was down 62% year-over-year, due to $63
million in lower accruals for cash bonuses in addition to mark-to-market losses
on investments related to employee deferred compensation. The mark-to-market
losses decreased incentive compensation by $51 million, versus an $11 million
increase in the third quarter of 2007. Investments related to employee deferred
compensation stood at $519 million at the end of the third quarter of '08, down
almost 20% sequentially.
Commissions
fell by 18%, as declines in our three asset management channels were partially
offset by an increase in Institutional Research Services. Fringes and other
expenses fell by 16%, predominantly due to lower payroll taxes, a function of
lower year-end bonus accruals, as well as lower recruitment
expenses.
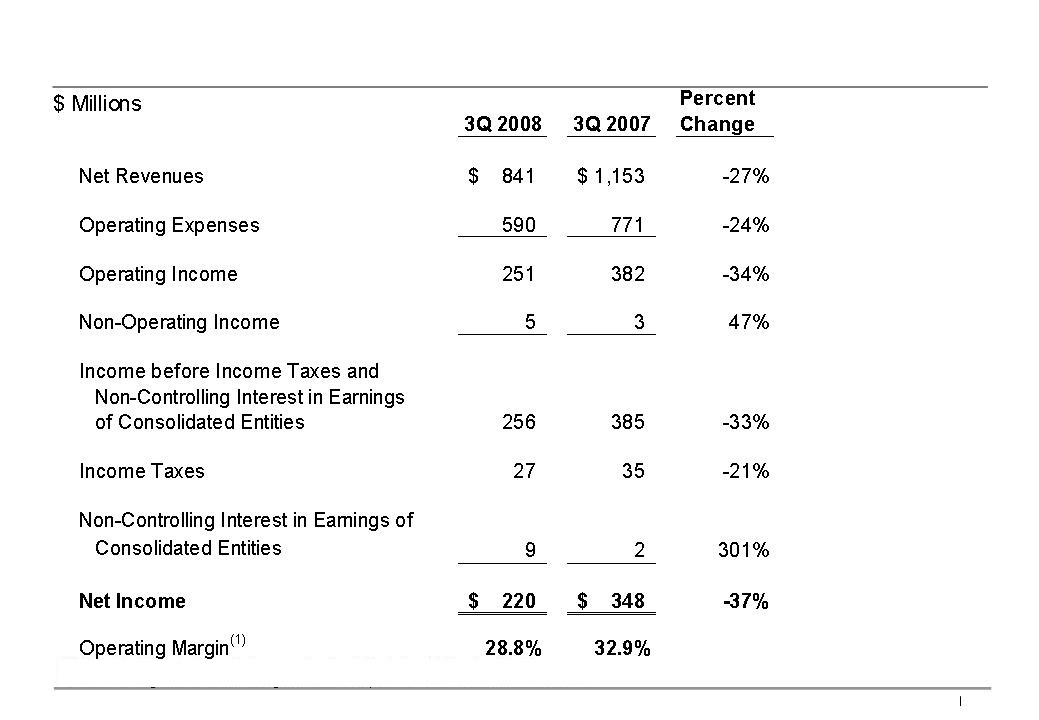
On
Display 18, you will find a summarized income statement for the Operating
Partnership. Despite aggressive management of controllable expenses, the severe
decline in AUM, and consequently revenues, led to a 37% drop in Net Income and a
410 basis point decline in operating margin.
Display
19 details the impact on the Holding company. Here you will note that while Net
Income for the Holding Company fell 39% and is in-line with the decline for the
Operating Partnership, our distribution per Unit actually fell by 50%. This was
due to excluding a $35 million insurance recovery from distributions in the
quarter. You will recall that when we took a $56 million charge against earnings
in the fourth quarter of 2006 for a class action claims processing error, we did
not reduce the distribution for that quarter and fourth quarter '06 distribution
was $0.21 greater than EPU. This $35 million was a part of the resolution of our
insurance and claims, a portion of which we are still hopeful will be realized
in the future.
Before I
wrap up, I would like to briefly address the overall health of
AllianceBernstein. Our firm is one of the world’s largest organizations focused
exclusively on investment research and management for our clients. We are not a
commercial bank, and we neither originate mortgages nor hold proprietary
positions in mortgage-backed securities that are at the epicenter of the recent
credit problems. Nor are we an investment bank or an insurance company that
engages in investment banking activities, thereby having direct exposure to
troubled assets. Additionally, AllianceBernstein has long maintained a
conservative balance sheet, which is reflected in our strong long-term credit
ratings, with S&P at AA-, Moody's at A1, and Fitch at A+.
Clearly,
as securities valuations globally have dropped, so have our assets under
management and, accordingly, our profitability. However, in the face of a likely
continuation of capital markets turmoil, Lew and I are confident in our
investment and client service professionals, and we are confident that they will
work closely with our clients to see them through this period of stress and
volatility and that our management team will continue to control expenses. Our
balance sheet is strong, our intellectual capital is intact, our expenses and
capital outlays are being aggressively managed while we continue to invest in
our most important strategic initiatives. Therefore, we firmly believe
AllianceBernstein is well-positioned for the future and that our efforts will
benefit all of our stakeholders in the long run. And now, I will turn the call
over to Lew.
Lew Sanders: Thanks,
Jerry.
As Jerry
has highlighted, extremely adverse capital markets conditions are placing
serious pressure on the firm. While we don't face the capital adequacy issues or
the funding problems that have become problematic for some in the industry, we
do face challenges of a different kind.
The
collapse in the equity markets throughout the world, coupled with weak relative
returns, has resulted in a dramatic decline in assets under management. The
strength of the U.S. dollar has exacerbated this effect, given the global
character of our product array. In addition, as Jerry outlined in his remarks,
widespread client anxiety has curtailed the flow of new business and increased
redemptions, especially among retail investors.
With
assets under management being the key driver of our revenue, there is now a
clear need to align the cost structure of the firm with a meaningfully lower
revenue run rate. In the past, we have been reluctant to react to short run
fluctuations in revenue - but these are not normal times.
As you
all know, a substantial portion of our operating expense structure is variable
in nature and that will be helpful in reducing costs. For example, Incentive
Compensation, both cash and deferred, will fall sharply, especially in the upper
ranks of the firm. But we have to do more. We have to right-size the Company to
reflect its reduced asset base.
Now, as
we proceed down this path, we will be mindful, however, of three equally
important objectives: First and foremost, that we don't do anything
that could in any way interfere with our ability to deliver on the
firm's mission -- the long-term investment success of our clients and their
piece of mind, a formidable task, to say the least, given the current market
turmoil, but to which we are steadfastly dedicated.
Second,
we need to ensure that despite the current pressures we position the firm to
grow when the turmoil subsides. Thus, we must continue to fund those initiatives
that we see as critical to our long term growth -- and let me assure you that
that's our plan.
And
third, we have to remain a meritocracy. Now, that's a worthy objective at all
times, but it is even more important in difficult times.
Consistent
with these objectives, we will not be pursuing formulated headcount reductions.
Rather, we've asked the leadership of each business unit to consider carefully
and thoughtfully the number of employees they need to manage their areas, given
our reduced scale. And of course, those numbers are going to be lower than we
now have.
This
process will be implemented, in large part, in this year's fourth quarter, and
will require a charge against earnings. The size of that charge has not yet been
determined, but the payback in reduced costs will far more than offset it in
2009.
Now,
letting people go we have respect and affection for is really hard, perhaps the
hardest thing to do in business -- but we simply have no choice. Fortunately, we
believe we have the depth and breadth of talent to do so without damaging the
firm's future.
Now, if
there's one benefit of age -- and frankly, it's the only one I can think of – it
is that you have seen tough times before. And I have. I lived through many bear
markets when I first entered the business in 1966, and then in 1970, 1982 and
1987, bear markets which produced price declines of 15 to 30%. I lived through a
devastating bear market in 1973 and 1974, where the cumulative decline reached
43%. And of course, more recently, the bursting of the internet bubble, which
before it came to a close in late 2002 produced a decline of 45%.
Let me
assure you that all of these episodes felt just as terrible as this one does. At
the trough they felt as if there was no hope, that the problems that created all
the trouble were intractable, and would take years to resolve. But in all of
those cases, countervailing forces surfaced, some as a function of government
actions, others from market-based adjustments, and the tide turned. Investment
performance was restored and growth resumed.
I remain
highly confident that the actions we are taking will position us to take
advantage of that recovery for our clients and for the firm. And if history is a
guide, it will arrive sooner and be stronger than generally
expected.
And now,
for your questions.
Operator: Management has
requested that you please limit your initial questions to two in order to
provide all callers an opportunity to ask questions. We welcome you to return to
the queue to ask follow-pp questions. It is AllianceBernstein’s practice to take
all questions in the order in which they are received and to empty the queue
before ending the call. Your first question comes from William
Katz.
William Katz: Thank you, and
good afternoon. My first question is probably on everyone's mind. I am trying to
think about quantifying the potential cost reductions in light of the decline in
revenues. How should we think about that? And when looking at your earnings over
the last several years, and your assets are now back to where they were in the
first quarter of '06 in round numbers, your compensation is relatively flat. So
I am struggling to see where the expense savings would come from.
Jerry Lieberman: Bill, as Lew
mentioned, we're still putting together a plan, but one that we will be
executing through the fourth quarter. This will be a reduction in force that's
unprecedented in the 40-year history of our firm. This is going to be
meaningful. We're talking about severance in the tens of millions of dollars,
all of which we hope to have a payback on, and expect to have a payback on, in
'09.
William Katz: Okay. The second
question I have is around the hedge fund and alternatives businesses. If I look
back at that slide, I think it was down about 20% sequentially. Is it fair to
assume that the bulk of that decline is performance-related?
Jerry Lieberman: It's all
performance-related. Our hedge funds give our clients twice a year opportunities
to get out of the hedge funds and the next period coming up will be the end of
the year. It's still early for those decisions to be made but I can tell you
that as of now, it hasn't shown to be meaningful. But they have a month to
really make the decision, Bill. But everything you see here is
performance-related.
William Katz: Just so I
understand it, any redemption of that would then be in the January
quarter?
Jerry Lieberman: That's
right.
William Katz: Could you give
us an update on the percentage of hedge funds that have high water marks, and
how much of those are now greater than 10%, consistent with your 10-Q
disclosure?
Jerry Lieberman: Bill, I don't
have that with me.
Lew Sanders: Bill, I think you
can assume that the high water marks are a meaningful impediment to the
re-emergence of performance fees for the foreseeable future
William Katz: Okay. Thank you,
Lew.
Operator: Your next question
comes from Craig Siegenthaler.
Craig Siegenthaler: Thanks.
Can I get some clarification on the general and administration expenses? You had
about $36 million of insurance recoveries benefiting that line but on top of
that, you said there was some other kind of one-time negatives against that. How
should we think about the true run rate for that item?
Jerry Lieberman: I'm not sure
the others were one-time negatives.
Craig Siegenthaler: The data
processing costs --
Jerry Lieberman: Those aren't
one-time at all. Those are data processing costs that are related to
transactions in the trading business. So, to the extent that the volume of
trading increases in the business, those are going to go up, if trading
decreases, those will go down. Those are volume-related expenses. You can look
at foreign exchange as one-time, and it depends on how the dollar strengthens or
weakens from quarter to quarter.
Lew Sanders: So the bottom
line here is if you add back the insurance adjustment that represents a
reasonably good estimate of the run rate. And of course, we'll be working hard
to do what we can to contain those costs in the period ahead, but there is a
substantial fraction of those costs that are fixed.
Craig Siegenthaler: Got it.
And then on net flows. When I think about your institutional business, a lot of
the growth came from outside the U.S. with large institutions over the last one
to two years. Those clients are newer, and when looking at terminations in that
business, they are holding in pretty well in institutions. In previous cycles
when you had relative performance and absolute performance being very low, where
did terminations relative to the AUM kind of flow here?
Jerry Lieberman: To date, as I
mentioned in the call, except for our mutual funds, the clients have been
staying with us, and pretty steadily to date. And obviously they're looking at
both absolute and relative performance. They're looking at how we are servicing
them and so far, they have been holding on pretty strongly. Does that answer
your question, Craig?
Craig Siegenthaler: Yes. Thank
you.
Operator: Your next question
comes from Marc Irizarry.
Marc Irizarry: Great. Lew,
maybe you can take this one. If you just think about returns over time, active
versus passive, do you expect, given where the three and five year numbers are
relative to the benchmark now, that institutions may take another look at their
allocation between passive and active managers? And then I have a follow-up.
Thanks.
Lew Sanders: They may well,
Marc, but if history is a guide in this subsequent recovery which, once again,
based on history, will be sooner and stronger than might appear likely, active
returns tend to actually be quite strong. So looking right now, with end point
sensitivity focused on an extremely adverse moment in time, it might appear as
if there's quite a lot of vulnerability, but that could well change in a
subsequent recovery and moot the issue about allocation between passive and
active that you are suggesting might apply.
Marc Irizarry: And then,
Jerry, one for you. Can you give us a sense of what sort of a run rate of
revenue is going to be heading out? And clearly, you don't want to cut into
muscle, but what's the target operating margin? How should we think about the
target operating margin for this business on a longer term basis?
Jerry Lieberman: Marc, we've
never had margin targets in either the good times or the bad times, and we don't
have one now. There's a lot of leverage in this business, so it's hard to
forecast. What I can assure you and assure the unit holders is if we continue to
see the turmoil that we've seen, and if we see markets continue to go down and
our revenues go down, we will address this in an appropriate
manner.
Marc Irizarry: Great, I'll get
back in the queue.
Operator: Your next question
comes from Cynthia Mayer
Cynthia Mayer: Hi, good
afternoon. Circling back to the cost-cutting, if you are not thinking about it
in terms of operating margin, I'm wondering what will you be using to gauge how
much is enough AUM decline or revenues decline? How will you know when the
business has come back to you with their numbers, whether that looks good enough
for you?
Jerry Lieberman: What we do
here is look at revenues, not AUM and again, we've never had margin targets, and
we've never had AUM targets, but we are consistently, and very, very frequently
reforecasting our revenues, even daily, because of the systems that we have in
place. We are looking for what is going to happen to our P&L going forward,
and do we have the right structure against what that P&L is. Now clearly,
what we've built up in the last few years is a structure to be a larger firm,
and we had $817 billion a year ago, and we built ourselves up to accommodate
client needs for a firm that size. We are taking on here a downsizing which is
unprecedented in the history of either Alliance or Bernstein in a serious
way.
Lew Sanders: And Cynthia, let
me just add that the objective here is to ensure we successfully negotiate
through what is already a deep trough. That's the objective, not only by the way
we form portfolios for clients, but by the way we manage the firm. So when we
are thinking about cost structure targets, it's with that in
mind.
Cynthia Mayer: Okay. I was
just looking back at what happened in 2001. It looked like you cut operating
expenses by 11%. Are you using that at all as an example of how you should cut
costs at this time?
Lew Sanders: It is
already obvious that we are well above the contraction and expense that was
necessary then and we are, as we've described, embarking on a substantial
additional reduction in expense in the period ahead.
Cynthia Mayer: Okay, great.
And just a very quick mechanics question. The charge against earnings in fourth
quarter, would that lower the cash distribution or not affect it?
Jerry Lieberman: Yes, it will,
Cynthia. That's a cash charge that will affect the distribution. Although as
we've said, we're looking at a quite a quick payback in '09.
Cynthia Mayer: Great. Thank
you.
Jerry Lieberman: Let me just
say this, and this is both for Cynthia and Marc and probably for Bill who has
been asking this question about G&A since I joined the firm. When you look
at G&A, between technology related, a lot of which is infrastructure, and a
significant part is in deep variable costs, it’s office-related and is about
$120 million for the quarter. So, a lot of these costs are indeed fixed, unless
there's a turn in the business, because there's buying related expenses in
there. And then in the past, we've done a pretty good job at rationalizing
space, but you can do that only if indeed space frees up in the
firm.
Operator: Your next question
comes from Robert Lee.
Robert Lee: Thanks, good
afternoon. Lew, maybe you could highlight for us some of the continuing ongoing
areas for investment. Obviously, I'm assuming the DC business will be one clear
example, but could you maybe point out a couple of others?
Lew Sanders: Yes. Well, by far
and away, DC is the most important and although the thrust of this call is about
all of the pressure that the firm is now under because of capital market
conditions, we are actually very hopeful about our prospects in the DC market,
and have continued to do well in the competitions that we've entered, both in
medium, and especially in very large plans. We really think we have a compelling
value proposition, and that opportunity is really, really large. As I've
described, it's by far and away the largest institutional opportunity that's
available to us anywhere in the world. So it is perhaps the prime example of an
initiative that we will fully fund during this period of pressure. Others that
come to mind have to do with initiatives around new product development, which
holds promise for innovative services downstream. They are not all that
expensive to fund, but potentially meaningful contributors to the firm's revenue
and profitability, and perhaps more importantly, to the base of its intellectual
capital, as it might assist in managing some of the mainstream services. So the
R&D efforts are there too and will continue unaffected by these staff
cuts.
Robert Lee: Okay. And maybe
just one follow-up question. I mean, I know that so far, your institutional
client base has been sticky, and you haven't really seen too much in the way of
heightened redemptions there. But could you maybe talk about how you view your
consultant relationships in light of some of the performance challenges of the
past year or so that you've had? Are you finding that some of them have put you
in the penalty box and that may somehow impact your ability to accelerate growth
once the turn comes or anything like that?
Lew Sanders: That may come. It
hasn't as yet. As I think all of you know, investment performance is not about
trailing 12 months, or for that, matter trailing two years, it's about much
longer term records. And in some of the services where we have put up in the
last 12 months relatively weak returns, we have extremely competitive long-term
returns. This is not lost on a consulting community who know us well for a
really long time, and know us thoroughly, and understand our decision-making
processes, and actually can find in our history other such periods of adverse
return -- actually, in intervals that look something like the character of the
capital markets in the last 12 months. And so I think that a thoughtful review
of our results will show them to be actually well within the character of a
long-term performer, which is a really good one -- notwithstanding the last 12
months. So we're confident, pretty confident, that once recovery commences --
certainly once it has a degree of maturity -- that our competitive profile will
serve us relatively well -- on the assumption, of course, that in that recovery,
we perform as we anticipate. And of course, time will tell as to whether we
achieve those objectives.
Robert Lee: Okay. Thank
you.
Operator: Your next question
comes from William Katz.
William Katz:.I just want to
pick up on that last question. I'm curious, as you look at both the
institutional channel and also the private client channel, maybe to a lesser
extent retail, which is a bit more new in terms of its focus, you've always sort
of dubbed yourselves as risk adjusted return models. And yet, when I look at
your rolling one, three and five year track records and you think about where
AllianceBernstein has been big, particularly in the financial services area, how
do you answer the question about the disciplined sell rule in your portfolio,
and could this time be a little different as it relates to flow activity on the
other side of this?
Lew Sanders: Well, Bill, it
might. But let me answer your question about risk management. You know, value
investors see price depreciation as an opportunity, not a threat. It's a threat
if it turns out that the company in question isn't up to the task of getting
through the trough. And one or two typically don't, which is the point of
portfolio diversification. And on the other side of the trough, those that do
often benefit, sometimes quite substantially from the failures of those that
didn't. I mean, there are so many obvious examples of that in the current
setting, companies that effectuated, for instance, a creed of acquisitions on
extremely favoring terms, markets that are now consolidating, especially in the
banking space, that will have a return profile because of a change in the
character of competition that will probably be impressive on the other side of
this trough. If you go back, for instance, to the last credit cycle in 1990,
where there was a similar kind of intense pressure on financial service
companies, by the early '90s --'92,'93, '94 -- the winners from that downturn
were impressive in the results they produced, and we owned most of them, and I
look forward to a similar outcome here. But you really can't measure these
things until you see the cycle in its completion. And I'm sure we all look
forward to that point; and you know, our assumptions are -- our research points
to -- a similar pattern to those that we've seen in the past
William Katz: Okay. Thanks,
That's helpful. And then my second question is actually a two-part question. On
the defined contribution, the target date retirement fund side, can you give us
a sense of how flows looked this quarter versus last quarter and whether you've
seen any kind of reversal of inflow to outflow? And then on the overall retail
side in particular, any kind of detail between outflows, U.S. versus
non-U.S.?
Lew Sanders: What we're seeing
actually is new business and inflows. We are not seeing any deterioration. And
remember, too, our approach in DC is actually an open architecture. It's
actually a platform that enables the planned sponsor to build target-date
solutions that are custom-made and populated with asset managers, whether
passive or active, that they know well, perhaps they imported from their DB
side, or are now actually synthesizing for this new application. It's a very,
very flexible platform, and it's very low cost, and positions plan sponsors to
take a position now and alter it without disruption later. It is also amenable,
as we've stressed too, to guaranteed withdrawal benefits becoming part of the
package. I'm going on because I see this as really a transforming kind of
offering, and one we really do expect to do quite well, and already has, even in
this very troubled time. So it's still an immature business, there's no doubt
and against the scale of the company, will take a quite a while before it really
matters, but it promises to. And we're not seeing anything in the near term to
disrupt any of our expectations. Bill, I want to just go back to that
first question you asked, because it's important that -- this has come up a
number of times on this call, trailing one or two or three year performance, or
even five –it’s been influenced dominantly by the last 12 months, the very end
point sensitive computation. If you go back and you study the history of our
process, especially in the value domain, you'll find any number of episodes like
this. It's the character of active management, especially in value. It's not
unusual. And essentially what it sets up is an opportunity for very strong
relative return in the recovery, which never appears obvious during the trough.
If it appeared obvious, all of these depressed prices would never have
developed. But that's the sense of value investing; that's why it produces
strong returns over time, and why there can be a year or two when the opposite
is true. So I would suggest that when you think about us, you consider those
factors. Now of course, none of this is assured. We are anticipating recovery
and we are anticipating it will take a form that resembles history. We have
every reason to believe that. Our research points to it. But of course, that's
not a certainty.
William Katz: Well, to be
fair, leverage is coming at a system more broadly and you're bigger and some of
your products aren't as proven to the test of time so I think it's a little bit
more of an open question and that's why investors are more focused on it maybe
than you would like us to be.
Lew Sanders: Well, I'm not
suggesting you shouldn't be. Don't misunderstand. I think you clearly should.
This is by way of explanation, it's by a way of providing some
perspective.
William Katz: It's very
helpful. I appreciate that.
Jerry Lieberman: Let me touch
again on our new initiative in the DC space. If you remember, I mentioned the
pipeline being slightly down from the previous quarter. I think the last quarter
it was around $15 billion and this quarter was at $14 billion. The reason it is
actually slightly down is because of our increasing business in DC. This is
where the momentum in the firm is right now. And the potential here is, as Lew
mentioned, is huge for the firm. But it's even more than that, because we can
start out with perhaps a very plain vanilla service but we're in there so that
when the market does turn and the client has an opportunity to move from perhaps
passive services to active services, we've changed our relationship with the
client by having them on our platform. So this will be game-changing for us over
time.
Operator: Your next question
comes from Marc Irizarry.
Marc Irizarry: Okay, thanks.
Lew, you know, obviously the retail investors are under a tremendous amount of
cyclical pressure for sure, but also secular pressure in terms of the aging
population, et cetera. When the money does come out of hiding in money market
funds, do you think it's going to take a new set of retail products that maybe
you don't have today to capture share?
Lew Sanders: Again Marc, if
history is a guide, no. Think about it this way, Marc. The return to equity beta
promises to be extraordinary in recovery and, by the way, if you study
recoveries from extremely steep equity market declines, I think you'll be
reassured of that assertion. They tend to be much shorter in duration than you
imagine and extremely steep in magnitude, and retail investors, unfortunately,
are impressed with that, which is why they consistently trend follow, and now
are redeeming, and later observing those recoveries, will likely come back into
mainstream equity products. I know you guys have done this but if you take time
to study the speed with which equity markets recover, you'll be stunned by how
short it is. The last number of bear markets in the U.S., starting in the early
'60s, i'll just give you a couple of numbers. '62, a 22% decline, is completely
recovered in 10 months. '66, 6 months; '70, a 30% decline, completely recovered
in 9 months. '73, '74, a devastating bear market I lived through every day,
completely recovered, 18 months. The '82 decline, five months. The '87 crash, 17
months. The point is that as bad as things feel during these kind of settings,
the risk premium gets so high, the prices so disconnected to the underlying cash
flows of the companies in question, that you get these really sharp recoveries.
And then these products have a very different look and feel. It's the end point
sensitivity in the opposite direction.
Marc Irizarry: Understood. And
I wonder if there's data on 1929 through '33, as well?
Lew Sanders: There is. I'll
tell you what it is. The trough is June of '32, down a cool 85% from the peak of
August in 1929, 80% of which is recovered by December of 1936.
Marc Irizarry: Great, thanks,
Lew.
Operator: Your next question
comes from Cynthia Mayer
Cynthia Mayer: Hi, just a
couple of follow-ups. I was just wondering what you're seeing or thinking in
terms of after this period and how pension funds and other institutional clients
are going to feel about alternatives. If you think that they are still going to
want hefty allocations to alternatives, given your strategies are down
substantially, are you prepared with other products to be able to offer those
clients?
Lew Sanders: Well, I think
it's pretty clear that our alternative position in the institutional space has
been hurt by the developments in 2008, notwithstanding its pretty good track
record prior thereto. It will be a while before we become a competitive force in
that set of products. But remember, in my answer to an earlier question about
sustaining an appropriate level of R&D, we do have development efforts and
other alternatives that could prove promising if the research holds up. Speaking
about the industry more broadly, our assumptions are that alternatives will
continue to be a share gainer in the recovery period, because I think they will
have looked as if they were "capital preserving" against the damage of long-only
equity beta during a trauma. Because as you know, most alternatives ex-private
equity, have a small amount of equity beta. Even if they are involved in the
equity asset class, they tend to be a long-short strategy, many of which try to
be fairly close to market neutral. So a few, of course, don't deliver on their
promise, but many do, and even if the returns are disappointing, they look good
relative to the extremely negative results of equity market declines that have
been compiled in the last 18 months. And so on that ground, I would think the
migration to alternatives will continue. The private equity world, I think, is
still benefiting from a mark to market accounting set of principles, which
provide not complete insulation, of course, but some insulation from what's
underway in the securities markets. And they, too, are benefiting, at least so
far, from that perception.
Cynthia Mayer: Okay. And then
just finally, given where the stock price is, I know you don't typically buy
back shares, but I wonder if you'd be interested in that? Or alternatively, are
you considering changing the mix in comp more towards shares to conserve cash,
take advantage of the low stock price?
Lew Sanders: Well, Cynthia, as
you know, our mandate actually is to deliver our free cash flow to you, on the
presumption that you are an unit holder, Cynthia, or certainly those who you
advise, as opposed to we dedicating the use of that cash flow to share
repurchase, for instance. So we will continue in that mode. Now as to the shares
becoming a candidate for deferred compensation plans, well, they actually have
been. But, we, as you know, were trying to promote as our primary
goal alignment of the professional staff with clients and so we require that at
least half of any one's deferred comp be put into the firm services, and the
other half could go to the units, and in many cases, people have elected that
way. And with the stock this depressed, they might actually see it the way you
described.
Cynthia Mayer: Okay. Thank
you.
Operator: Your next question
comes from Chris Spahr.
Christopher Spahr: Good
evening. I was just wondering if you could differentiate with the expense
initiative structure. If this is strictly a cyclical downturn that we're in,
wouldn't this be the time to be expanding your share, trying to hire talent
rather than trying to cut back too much? A case in point would be your
institutional services, which I'm sure is benefiting from a lot of disruption of
some of your major competitors in the third quarter.
Jerry Lieberman: Chris, we
built the firm at a size to be $800 billion to, quite frankly, a trillion
dollars. That's where we thought we were headed. That's where we were, the $800
billion, and that's what the trends show we were going to. So there's a lot of
room between where we are today to get back to $800 billion to a trillion
dollars. If there's talent out there, it wouldn't stop us from trying
to pick out some outstanding talent, but it will be during a mode where our
headcount is going down so we'll have to find a way to finance getting great
talent that's out there, whether it's on the buy side or the sell side. We're
going to bring the fixed costs of the firm down, and the largest fixed costs we
have is hiring.
Christopher Spahr: And then in
that context, when the markets do rebound and value becomes in fashion for the
retail investor, will your expenses become more leverageable?
Lew Sanders: Yes, of
course.
Jerry Lieberman:
Absolutely.
Lewis Sanders: Of course it
will, just as it was in the last upside.
Jerry Lieberman: Absolutely.
And in fact, to Lew's point, if you go back to the history of the firm, when we
went into the last correction, we did some attrition. We didn't do any of the
RIF (reduction in force) that we're doing here. We did have some attrition, and
we did some consolidation and when the markets turned, our performance got
strong, revenues took off. There was a significant delay between that period of
when the revenues were taking off and the period when we started to do the
hiring. Actually, a few years and that will probably be the case when and if
this happens also.
Lew Sanders: Look, I think
it's worth adding, although I think it's obvious, that in this staff reduction
mode that we're in, we're going to be really careful about sustaining the
intellectual capital of the company, and taking advantage, to the extent it's
actually manifesting itself or presents itself to us as some opportunities, to
add to staff to the extent that that upgrade appears
compelling.
Christopher Spahr: Okay, thank
you.
Operator: There are no further
questions at this time.
Philip Talamo: Great. Thanks
for participating in our call. At any time, feel free to contact Investor
Relations if you have any further questions. Enjoy the rest of your
evening.