UNITED
STATES
SECURITIES
AND EXCHANGE COMMISSION
Washington,
D.C. 20549
FORM
8-K
CURRENT
REPORT
Pursuant
to Section 13 or 15(d) of the Securities Exchange Act of
1934
|
Date
of Report (Date of earliest event reported):
|
January
24, 2007
|
|
ALLIANCEBERNSTEIN
HOLDING
L.P.
|
|
(Exact
name of registrant as specified in its
charter)
|
|
Delaware
|
001-09818
|
13-3434400
|
|
(State
or other jurisdiction of
incorporation
or organization)
|
(Commission
File Number)
|
(I.R.S.
Employer Identification Number)
|
|
1345
Avenue of the Americas, New York, New York
|
10105
|
|
(Address
of principal executive offices)
|
(Zip
Code)
|
|
Registrant’s
telephone number, including area code:
|
212-969-1000
|
Check
the appropriate box below if the Form 8-K filing is intended to simultaneously
satisfy the filing obligations of the registrant under any of the following
provisions:
|
o
|
Written
communications pursuant to Rule 425 under the Securities Act (17
CFR
230.425)
|
|
o
|
Soliciting
material pursuant to Rule 14a-12 under the Exchange Act (17 CFR
240.14a-12)
|
|
o
|
Pre-commencement
communications pursuant to Rule 14d-2(b) under the Exchange Act (17
CFR
240.14d-2(b))
|
|
o
|
Pre-commencement
communications pursuant to Rule 13e-4(c) under the Exchange Act (17
CFR
240.13e-4(c))
|
|
Section
2.
|
Financial
Information
|
|
Item
2.02.
|
Results
of Operations and Financial
Condition.
|
AllianceBernstein
Holding L.P. (“AllianceBernstein Holding”) is furnishing the news release it
issued on January 24, 2007 concerning financial and operating results for the
quarter and full year ended December 31, 2006 (“4Q06 Earnings Release”). The
4Q06 Earnings Release is attached hereto as Exhibit 99.01.
AllianceBernstein
Holding is furnishing its Fourth Quarter 2006 Review, dated January 24, 2007
(“4Q06 Review”). The Fixed Income performance figures displayed on slide 36
reflect corrections to the version originally presented. The 4Q06 Review
is attached hereto as Exhibit 99.02.
AllianceBernstein
Holding is furnishing a transcript of its conference call with analysts relating
to financial and operating results for the quarter and full year ended December
31, 2006 (“4Q06 Transcript”). The call took place on January 24, 2007. The 4Q06
Transcript is attached hereto as Exhibit 99.03.
The
4Q06
Earnings Release, 4Q06 Review, and the conference call with analysts (reflected
in the 4Q06 Transcript) include forward looking statements predicting increases
in net asset inflows, describing the likelihood of improved performance by
growth equities relative to value equities, expecting an increase in assets
under management subject to performance fees and a related increase in
seasonal volatility, indicating anticipated expense
levels, estimating the impact a clerical error may have on our earnings, and
anticipating the recovery of most of the cost of this error. The actual
performance of financial markets generally, how our performance measures against
that of our competitors, and other factors we cannot control will affect our
asset inflows and whether performance by growth equities relative to value
equities improves. Performance-based fees are by nature seasonal and volatile
and thus difficult to predict. Our expense levels in future periods depend
in
part on headcount and office space needed in response to the growth in volume,
complexity and global nature of our firm. The estimate of the impact of the
clerical error is based on very preliminary data. Accordingly, the estimated
impact on earnings may prove inaccurate as we gather and analyze additional
information. In addition, our ability to recover most of the cost of the error
is dependent, in part, on the availability of funds from the related
class-action settlement fund, the amount of which is not known, and the
willingness of our insurers to reimburse us under existing policies for this
cost.
|
Section
7.
|
Regulation
FD
|
|
Item
7.01.
|
Regulation
FD Disclosure.
|
AllianceBernstein
Holding is furnishing the 4Q06 Earnings Release, which is attached hereto as
Exhibit 99.01.
AllianceBernstein
Holding is furnishing the 4Q06 Review, which is attached hereto as Exhibit
99.02.
AllianceBernstein
Holding is furnishing the 4Q06 Transcript, which is attached hereto as Exhibit
99.03.
|
Section
9.
|
Financial
Statements and
Exhibits
|
|
Item
9.01.
|
Financial
Statements and Exhibits.
|
|
(d)
|
Exhibits.
|
|
4Q06
Earnings Release.
|
|
4Q06
Review.
|
|
4Q06
Transcript.
|
SIGNATURES
Pursuant
to the requirements of the Securities Exchange Act of 1934, the registrant
has
duly caused this report to be signed on its behalf by the undersigned thereunto
duly authorized.
|
ALLIANCEBERNSTEIN
HOLDING
L.P.
|
|||
|
Dated:
January 25, 2007
|
By:
|
/s/
Robert H. Joseph, Jr.
|
|
|
Robert
H. Joseph, Jr.
|
|||
|
Senior
Vice President and
|
|||
|
Chief
Financial Officer
|
|||
| |
Philip
Talamo, Investor Relations
212.969.2383
ir@alliancebernstein.com
|
John
Meyers, Media
212.969.2301
pr@alliancebernstein.com
|
News
Release
AllianceBernstein
Holding L.P. Announces Fourth Quarter Diluted Net Income of $1.48 per Unit
and
Declares a $1.48 per Unit Cash Distribution
New
York, NY, January 24, 2007
-
AllianceBernstein Holding L.P. (“AllianceBernstein Holding”) (NYSE: AB) and
AllianceBernstein L.P. (“AllianceBernstein”) today reported financial and
operating results for the quarter and full year ended December 31,
2006.
AllianceBernstein
Holding (The Publicly Traded Partnership):
|
·
|
Diluted
net income per Unit
for the quarter ended December 31, 2006 was $1.48, an increase
of 45.1%
from $1.02 for
the same period in 2005. Diluted net income per Unit for full year
2006
was $4.02, up from $3.02 in 2005.
|
|
·
|
Distribution
per Unit
for the fourth quarter of 2006 will be $1.48, an increase of 45.1%
from
$1.02 for the same period in 2005. The distribution is payable
on February
15, 2007 to holders of AllianceBernstein Holding Units at the close
of
business on February 5, 2007. Total distributions per Unit for
full year
2006 will be $4.02, up from $3.00 for full year
2005.
|
AllianceBernstein
(The Operating Partnership):
|
·
|
Assets
Under Management (AUM)
at
December 31, 2006 were $716.9 billion, a 23.9% increase from a
year ago,
due to market appreciation and net inflows across all distribution
channels.
|
|
·
|
Net
inflows for the three months
ended December 31, 2006 were $10.6 billion, consisting of Institutional
Investments net inflows of $6.3 billion, Retail net inflows of
$2.3
billion and Private Client net inflows of $2.0
billion.
|
|
·
|
Net
inflows
(1)
for the twelve months
ended December 31, 2006 were $47.8 billion, consisting of Institutional
Investments net inflows of $27.2 billion, Retail net inflows of
$12.2
billion and Private Client net inflows of $8.4
billion.
|
____________________
|
(1)
|
Excludes
acquisition of Hong Kong joint venture interest,
and transfers of certain client accounts among distribution channels
resulting from changes in how these accounts are serviced by
the
firm.
|

“On
the
most important metric, investment results for our clients, 2006 was a mixed
year. Returns in value equity services were extremely strong, with most non-U.S.
and global value services exceeding benchmarks by substantial margins. Fixed
income returns were far lower in absolute terms but were, in general, above
benchmarks as well, in some cases substantially. Growth services were the
exception, the relative performance of which was weak, especially in the
U.S.
The headwinds faced by this style of equity management continued to blow
strongly throughout the year, adversely affecting the returns in our growth
services. The gap in valuation between growth and value equities has now
declined to a level that suggests continued pressure on growth performance
is
nearing an end. We believe that our growth services are positioned to benefit
from this changing condition,” said Lewis Sanders, Chairman and Chief Executive
Officer.
“The
company’s organic growth rate was strong in the fourth quarter and for all 2006.
Net asset inflows for the year totaled $47.8 billion, an 8.3% annual rate.
All
client groups contributed to this growth, with flows in our U.S. retail mutual
fund and managed account business showing the most improvement compared with
2005.
“Assets
under management in global and international services grew by 50% for the
full
year and accounted for 54% of AUM at year end 2006. Growth in AUM for non-U.S.
clients remained very strong as well, at 44% for the full year, driving non-U.S.
client share of total AUM to 36% by year’s end.
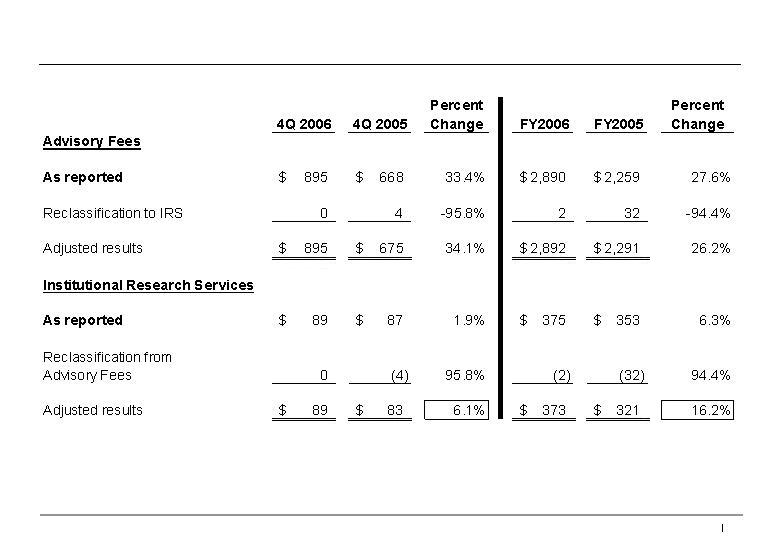
“Revenue
in our institutional research services grew modestly in the fourth quarter,
resulting in a full year increase of 6%. However, after adjusting for the
reclassification from investment advisory fees to institutional research
services of transaction charges associated with investment management clients,
which declined significantly from 2005 levels, the increase in revenue was
approximately 16%. Market share improved as a function of continued strong
growth in algorithmic trading volumes in the U.S. and increased client
acceptance of our research services domestically and in our London-based
operations.
“Financial
results for the operating partnership overall were strong in 2006, with revenue
rising by 23.0%, net earnings rising by 33.9%, and operating margins expanding
by 290 basis points to 30.9%. Fourth quarter earnings grew by 45.4%, exceeding
expectations, a function primarily of very strong performance-related fees,
reflecting excellent results for our clients and strong growth in assets
under
management subject to such fees.
|
www.alliancebernstein.com
|
2
of
9
|
“We
recently discovered a clerical error made while processing claims for
class-action settlement proceeds on behalf of certain of our clients, including
some AllianceBernstein-sponsored mutual funds. Based on preliminary data,
we
believe the cost of this error could be on the order of $0.15 per Unit, most
of
which we anticipate will be recovered from residual settlement proceeds and/or
insurance. As more complete information on the cost of this error becomes
available, permitting us to establish a reserve, an adjustment to fourth
quarter
2006 earnings may be required.
“Continued
advances in revenue and earnings for the firm are dependent on meeting the
needs
of our clients, as measured by investment returns and superior service, the
achievement of which remains our primary focus,” concluded Mr. Sanders.
CONFERENCE
CALL INFORMATION RELATING TO FOURTH QUARTER 2006 RESULTS
JANUARY
24, 2007 AT 5:00 P.M. (Eastern
Standard Time)
AllianceBernstein’s
management will review fourth quarter 2006 financial and operating results
on
Wednesday, January 24, 2007, during a conference call beginning
at 5:00 p.m.
(EST),
following the release of its financial results after the close of the New
York
Stock Exchange. The conference call will be hosted by Lewis A. Sanders, Chairman
and Chief Executive Officer, and Gerald M. Lieberman, President and Chief
Operating Officer.
Parties
may access the conference call by either telephone or webcast.
|
1.
|
To
listen by telephone, please dial 888-694-4676 in the U.S. or 973-582-2737
outside the U.S., ten minutes before the 5:00 p.m. (EST)
scheduled start time. The conference ID# is
8315265.
|
|
2.
|
To
listen by webcast, please visit AllianceBernstein’s Investor Relations
website at http://ir.alliancebernstein.com at least fifteen minutes
prior
to the call to download and install any necessary audio
software.
|
The
presentation slides that will be reviewed during the conference call are
expected to be available on AllianceBernstein’s website at the above web address
after the release of its results on January 24, 2007.
An
audio
replay of the conference call will be made available for one week beginning
at
7:00 p.m. (EST)
on
January 24, 2007. In the U.S., please call (877) 519-4471 or, outside the
U.S.,
call (973) 341-3080, and provide the conference ID# 8315265. The replay will
also be available via webcast on AllianceBernstein’s website for one
week.
About
AllianceBernstein
AllianceBernstein
is a leading global investment management firm providing investment management
services for many of the largest U.S. public and private employee benefit
plans,
foundations, public employee retirement funds, pension funds, endowments,
banks,
insurance companies and high-net-worth individuals worldwide. AllianceBernstein
is also one of the largest mutual fund sponsors, with a diverse family of
globally distributed mutual fund portfolios. Through its subsidiary, Sanford
C.
Bernstein & Co., LLC, AllianceBernstein provides in-depth research,
portfolio strategy and trade execution to the institutional investment
community.
|
www.alliancebernstein.com
|
3
of
9
|
At
December 31, 2006, AllianceBernstein Holding owned approximately 33.1% of
the
issued and outstanding AllianceBernstein Units. AXA Financial was the beneficial
owner of approximately 59.9% of the AllianceBernstein Units at December 31,
2006
(including those held indirectly through its ownership of approximately 1.7%
of
the issued and outstanding Holding Units) which, including the general
partnership interests in AllianceBernstein and Holding, represent an approximate
60.3% economic interest in AllianceBernstein. AXA Financial is a wholly-owned
subsidiary of AXA, one of the largest global financial services
organizations.
Forward-Looking
Statements
Certain
statements in this news release are “forward-looking statements” within the
meaning of the Private Securities Litigation Reform Act of 1995. These
forward-looking statements are subject to risks, uncertainties, and other
factors that could cause actual results to differ materially from future
results
expressed or implied by such forward-looking statements. The most significant
of
these factors include, but are not limited to, the following: the performance
of
financial markets, the investment performance we achieve for our clients,
general economic conditions, future acquisitions, competitive conditions,
and
government regulations, including changes in tax rates. We caution readers
to
carefully consider our forward-looking statements in light of these factors.
Further, these forward-looking statements speak only as of the date on which
such statements are made; we undertake no obligation to update any
forward-looking statements to reflect subsequent events or circumstances.
For
further information regarding these forward-looking statements and the factors
that could cause actual results to differ, see “Risk Factors” in Item 1 of Form
10-K for the year ended December 31, 2005. Any or all of the forward-looking
statements that we make in Form 10-K, this news release, or any other public
statements we issue may turn out to be wrong. Of
course, factors other than those listed in “Risk Factors” could also adversely
affect our revenues, financial condition, results of operations, and business
prospects.
The
forward-looking statements referred to in the preceding paragraph include
statements regarding an end to pressure on investment returns of growth equities
relative to value equities, and our belief that our growth services are
positioned to benefit from this changing condition. The actual performance
of
financial markets and other factors beyond our control will affect our
investment success.
|
www.alliancebernstein.com
|
4
of
9
|
ALLIANCEBERNSTEIN
L.P.
(THE
OPERATING PARTNERSHIP)
SUMMARY
CONSOLIDATED STATEMENTS OF INCOME
DECEMBER
31, 2006
(unaudited,
in thousands)
|
Three
Months Ended
|
Twelve
Months Ended
|
||||||||||||
|
12/31/06
|
12/31/05
|
12/31/06
|
12/31/05
|
||||||||||
|
Revenues:
|
|||||||||||||
|
Investment
Advisory & Services Fees
|
$
|
895,383
|
$
|
667,773
|
$
|
2,890,229
|
$
|
2,259,392
|
|||||
|
Distribution
Revenues
|
109,949
|
97,066
|
421,045
|
397,800
|
|||||||||
|
Institutional
Research Services
|
88,769
|
87,103
|
375,075
|
352,757
|
|||||||||
|
Dividend
and Interest Income
|
86,050
|
55,677
|
266,520
|
152,781
|
|||||||||
|
Investment
Gains (Losses)
|
23,871
|
5,401
|
53,134
|
28,631
|
|||||||||
|
Other
Revenues
|
32,923
|
29,088
|
132,237
|
117,227
|
|||||||||
|
Total
Revenues
|
1,236,945
|
942,108
|
4,138,240
|
3,308,588
|
|||||||||
|
Less:
Interest Expense
|
50,247
|
31,522
|
187,833
|
95,863
|
|||||||||
|
Net
Revenues
|
1,186,698
|
910,586
|
3,950,407
|
3,212,725
|
|||||||||
|
Expenses:
|
|||||||||||||
|
Employee
Compensation & Benefits
|
427,845
|
341,182
|
1,547,627
|
1,262,198
|
|||||||||
|
Promotion
& Servicing:
|
|||||||||||||
|
Distribution
Plan Payments
|
77,632
|
67,009
|
292,886
|
291,953
|
|||||||||
|
Amortization
of Deferred Sales Commissions
|
28,721
|
28,836
|
100,370
|
131,979
|
|||||||||
|
Other
|
57,359
|
51,359
|
218,944
|
198,004
|
|||||||||
|
General
& Administrative
|
140,975
|
109,451
|
527,296
|
384,339
|
|||||||||
|
Interest
on Borrowings
|
2,905
|
6,249
|
23,124
|
25,109
|
|||||||||
|
Amortization
of Intangible Assets
|
5,178
|
5,175
|
20,710
|
20,700
|
|||||||||
|
740,615
|
609,261
|
2,730,957
|
2,314,282
|
||||||||||
|
Operating
Income
|
446,083
|
301,325
|
1,219,450
|
898,443
|
|||||||||
|
Non-Operating
Income
|
3,903
|
10,227
|
20,196
|
34,446
|
|||||||||
|
Income
before Income Taxes
|
449,986
|
311,552
|
1,239,646
|
932,889
|
|||||||||
|
Income
Taxes
|
28,557
|
21,666
|
76,568
|
64,571
|
|||||||||
|
NET
INCOME
|
$
|
421,429
|
$
|
289,886
|
$
|
1,163,078
|
$
|
868,318
|
|||||
|
Operating
income margin
|
37.6
|
%
|
33.1
|
%
|
30.9
|
%
|
28.0
|
%
|
|||||
|
www.alliancebernstein.com
|
5
of
9
|
ALLIANCEBERNSTEIN
HOLDING L.P.
(THE
PUBLICLY TRADED PARTNERSHIP)
SUMMARY
STATEMENTS OF INCOME
(unaudited,
in thousands except per unit amounts)
|
Three
Months Ended
|
Twelve
Months Ended
|
||||||||||||
|
12/31/06
|
12/31/05
|
12/31/06
|
12/31/05
|
||||||||||
|
Equity
in Earnings of Operating Partnership
|
$
|
137,592
|
$
|
92,143
|
$
|
377,298
|
$
|
275,054
|
|||||
|
Income
Taxes
|
10,334
|
7,607
|
34,473
|
26,990
|
|||||||||
|
NET
INCOME
|
127,258
|
84,536
|
342,825
|
248,064
|
|||||||||
|
Additional
Equity in Earnings of Operating Partnership (1)
|
2,161
|
1,292
|
5,581
|
3,326
|
|||||||||
|
NET
INCOME - Diluted (2)
|
$
|
129,419
|
$
|
85,828
|
$
|
348,406
|
$
|
251,390
|
|||||
|
DILUTED
NET INCOME PER UNIT
|
$
|
1.48
|
$
|
1.02
|
$
|
4.02
|
$
|
3.02
|
|||||
|
|
|
|
|
||||||||||
|
DISTRIBUTION
PER UNIT
|
$
|
1.48
|
$
|
1.02
|
$
|
4.02
|
$
|
3.00
|
|||||
|
(1)
|
To
reflect higher ownership in the Operating Partnership resulting
from
application of the treasury stock method to outstanding
options.
|
|
(2)
|
For
calculation of Diluted Net Income per
Unit.
|
ALLIANCEBERNSTEIN
AND ALLIANCEBERNSTEIN HOLDING
UNITS
OUTSTANDING AND WEIGHTED AVERAGE UNITS OUTSTANDING
DECEMBER
31, 2006
|
Weighted
Average Units
|
||||||||||||||||
|
Three
Months Ended
|
Twelve
Months Ended
|
|||||||||||||||
|
Period
End
|
||||||||||||||||
|
Units
|
Basic
|
Diluted
|
Basic
|
Diluted
|
||||||||||||
|
AllianceBernstein
|
259,062,014
|
258,573,531
|
260,889,296
|
257,718,845
|
259,961,614
|
|||||||||||
|
AllianceBernstein
Holding
|
85,668,171
|
85,179,688
|
87,495,453
|
84,325,002
|
86,567,771
|
|||||||||||
|
www.alliancebernstein.com
|
6
of
9
|
ALLIANCEBERNSTEIN
L.P.
ASSETS
UNDER MANAGEMENT
THREE
MONTHS ENDED DECEMBER 31, 2006
($
millions)
|
|
Institutional
|
|
Private
|
|
|||||||||
|
|
Investments
|
Retail
|
Client
|
Total
|
|||||||||
|
|
|
|
|
|
|||||||||
|
Beginning
of Period
|
$
|
417,818
|
$
|
153,906
|
$
|
87,559
|
$
|
659,283
|
|||||
|
|
|
|
|
|
|||||||||
|
Sales/New
accounts
|
16,053
|
10,936
|
3,488
|
30,477
|
|||||||||
|
Redemptions/Terminations
|
(8,202
|
)
|
(8,490
|
)
|
(895
|
)
|
(17,587
|
)
|
|||||
|
Cash
flow
|
(1,531
|
)
|
307
|
(434
|
)
|
(1,658
|
)
|
||||||
|
Unreinvested
dividends
|
(1
|
)
|
(402
|
)
|
(193
|
)
|
(596
|
)
|
|||||
|
Net
inflows
|
6,319
|
2,351
|
1,966
|
10,636
|
|||||||||
|
|
|
|
|
|
|||||||||
|
Market
appreciation
|
30,932
|
10,671
|
5,373
|
46,976
|
|||||||||
|
|
|
|
|
|
|||||||||
|
End
of Period
|
$
|
455,069
|
$
|
166,928
|
$
|
94,898
|
$
|
716,895
|
|||||
ALLIANCEBERNSTEIN
L.P.
ASSETS
UNDER MANAGEMENT
TWELVE
MONTHS ENDED DECEMBER 31, 2006
($
millions)
|
|
Institutional
|
|
Private
|
|
|||||||||
|
|
Investments
|
Retail
|
Client
|
Total
|
|||||||||
|
|
|
|
|
|
|||||||||
|
Beginning
of Period
|
$
|
358,545
|
$
|
145,134
|
$
|
74,873
|
$
|
578,552
|
|||||
|
|
|
|
|
|
|||||||||
|
Sales/New
accounts
|
53,800
|
44,313
|
14,436
|
112,549
|
|||||||||
|
Redemptions/Terminations
|
(18,166
|
)
|
(31,030
|
)
|
(2,910
|
)
|
(52,106
|
)
|
|||||
|
Cash
flow
|
(8,397
|
)
|
(10
|
)
|
(2,718
|
)
|
(11,125
|
)
|
|||||
|
Unreinvested
dividends
|
(1
|
)
|
(1,075
|
)
|
(443
|
)
|
(1,519
|
)
|
|||||
|
Net
inflows
|
27,236
|
12,198
|
8,365
|
47,799
|
|||||||||
|
|
|
|
|
|
|||||||||
|
Acquisition
(1)
|
321
|
92
|
-
|
413
|
|||||||||
|
Transfers
(2)
|
7,918
|
(9,155
|
)
|
1,237
|
-
|
||||||||
|
|
|
|
|
|
|||||||||
|
Market
appreciation
|
61,049
|
18,659
|
10,423
|
90,131
|
|||||||||
|
|
|
|
|
|
|||||||||
|
End
of Period
|
$
|
455,069
|
$
|
166,928
|
$
|
94,898
|
$
|
716,895
|
|||||
|
(1)
|
Acquisition
of Hong Kong joint venture
interest.
|
|
(2)
|
Transfer
of certain client accounts were made among distribution channels
resulting
from changes in how these accounts are serviced by the
firm.
|
|
www.alliancebernstein.com
|
7
of
9
|
ALLIANCEBERNSTEIN
L.P.
ASSETS
UNDER MANAGEMENT
BY
INVESTMENT SERVICE
AT
DECEMBER 31, 2006
($
millions)
|
|
Institutional
Investments
|
Retail
|
Private
Client
|
Total
|
|||||||||
|
Equity:
|
|
|
|
|
|||||||||
|
Growth
|
|
|
|
|
|||||||||
|
U.S.
|
$
|
36,670
|
$
|
28,587
|
$
|
13,237
|
$
|
78,494
|
|||||
|
Global
& International
|
66,242
|
19,937
|
9,418
|
95,597
|
|||||||||
|
|
102,912
|
48,524
|
22,655
|
174,091
|
|||||||||
|
Value
|
|
|
|
|
|||||||||
|
U.S.
|
55,562
|
35,749
|
27,703
|
119,014
|
|||||||||
|
Global
& International
|
158,572
|
38,797
|
19,091
|
216,460
|
|||||||||
|
|
214,134
|
74,546
|
46,794
|
335,474
|
|||||||||
|
|
|
|
|
|
|||||||||
|
Total
Equity
|
317,046
|
123,070
|
69,449
|
509,565
|
|||||||||
|
|
|
|
|
|
|||||||||
|
Fixed
Income:
|
|
|
|
|
|||||||||
|
U.S.
|
73,414
|
11,420
|
25,032
|
109,866
|
|||||||||
|
Global
& International
|
39,166
|
27,614
|
328
|
67,108
|
|||||||||
|
|
112,580
|
39,034
|
25,360
|
176,974
|
|||||||||
|
|
|
|
|
|
|||||||||
|
Index/Structured:
|
|
|
|
|
|||||||||
|
U.S.
|
19,942
|
4,824
|
80
|
24,846
|
|||||||||
|
Global
& International
|
5,501
|
-
|
9
|
5,510
|
|||||||||
|
|
25,443
|
4,824
|
89
|
30,356
|
|||||||||
|
|
|
|
|
|
|||||||||
|
Total:
|
|
|
|
|
|||||||||
|
U.S.
|
185,588
|
80,580
|
66,052
|
332,220
|
|||||||||
|
Global
& International
|
269,481
|
86,348
|
28,846
|
384,675
|
|||||||||
|
|
$
|
455,069
|
$
|
166,928
|
$
|
94,898
|
$
|
716,895
|
|||||
|
www.alliancebernstein.com
|
8
of
9
|
ALLIANCEBERNSTEIN
L.P.
ASSETS
UNDER MANAGEMENT
($
millions)
|
|
Three
Month Period
|
Twelve
Month Period
|
|||||||||||
|
|
12/31/06
|
12/31/05
|
12/31/06
|
12/31/05
|
|||||||||
|
|
|
|
|
|
|||||||||
|
Ending
Assets Under Management
|
$
|
716,895
|
$
|
578,552
|
$
|
716,895
|
$
|
578,552
|
|||||
|
|
|
|
|
|
|||||||||
|
Average
Assets Under Management
|
$
|
689,225
|
$
|
563,024
|
$
|
640,966
|
$
|
541,159
|
|||||
ALLIANCEBERNSTEIN
L.P.
ASSETS
UNDER MANAGEMENT
BY
CLIENT DOMICILE
AT
DECEMBER 31, 2006
($
millions)
|
|
Institutional
Investments
|
Retail
|
Private
Client
|
Total
|
|||||||||
|
|
|
|
|
|
|||||||||
|
U.S.
Clients
|
$
|
241,044
|
$
|
126,674
|
$
|
92,388
|
$
|
460,106
|
|||||
|
Non-U.S.
Clients
|
214,025
|
40,254
|
2,510
|
256,789
|
|||||||||
|
|
$
|
455,069
|
$
|
166,928
|
$
|
94,898
|
$
|
716,895
|
|||||
|
www.alliancebernstein.com
|
9
of
9
|

Fourth-Quarter
2006
Review
AllianceBernstein
Fourth
Quarter
2006 Review
Gerald
M.
Lieberman
President
&
Chief Operating Officer
Lewis
A.
Sanders
Chairman
&
Chief
Executive Officer
Any
forecasts in this material may not be realized. Information or opinions
should
not be construed as investment advice.
January
24,
2007
1

Fourth-Quarter
2006
Review
Proprietary
–
For
AllianceBernstein L.P. use only
AllianceBernstein
Forward-Looking
Statements
Certain
statements in this presentation and the accompanying oral remarks are
“forward-looking statements” within the meaning of the Private Securities
Litigation Reform Act of 1995. These forward-looking statements are
subject to risks, uncertainties, and other factors that could cause actual
results to differ materially from future results expressed or implied
by such
forward-looking statements. The most significant of these factors include,
but
are not limited to, the following: the performance of financial markets;
the
investment performance we achieve for our clients; general economic conditions;
future acquisitions; competitive conditions; and government regulations,
including changes in tax rates. We caution readers to carefully consider
our forward-looking statements in light of these factors. Further, these
forward-looking statements speak only as of the date on which such statements
are made; we undertake no obligation to update any forward-looking statements
to
reflect subsequent events or circumstances. For further information
regarding these forward-looking statements and the factors that could
cause
actual results to differ, see “Risk Factors” in Item 1 of Form 10-K for the year
ended December 31, 2005. Any or all of the forward-looking statements that
we make in Form 10-K, this news release, or any other public statements
we issue
may turn out to be wrong. Of course, factors other than those listed
in “Risk
Factors” could also adversely affect our revenues, financial condition, results
of operations, and business prospects.
The
oral remarks accompanying this presentation include forward looking statements
predicting increases in net asset inflows, describing the likelihood
of improved
performance by growth equities relative to value equities, expecting
an increase
in assets under management subject to performance fees and a related
increase in
seasonal volatility, and indicating anticipated expense levels. The actual
performance of financial markets generally, how our performance measures
against
that of our competitors, and other factors we cannot control will affect
our
asset inflows and whether performance by growth equities relative to
value
equities improves. Performance-based fees are by nature seasonal and
volatile
and thus difficult to predict. Our expense levels in future periods depend
in part on headcount and office space needed in response to the growth
in
volume, complexity and global nature of our firm.
In
light of
Regulation FD, management will be limited in responding to inquiries
from
investors or analysts in a non-public forum.
Introduction
2

Fourth-Quarter
2006
Review
Proprietary
–
For
AllianceBernstein L.P. use only
AllianceBernstein
<
Capital
markets
strong
<
Relative
performance
somewhat mixed, but with substantial exceptions
<
Strong
market
appreciation and net AUM inflows across all channels
<
Summary
of financial
performance vs. 4Q05
=
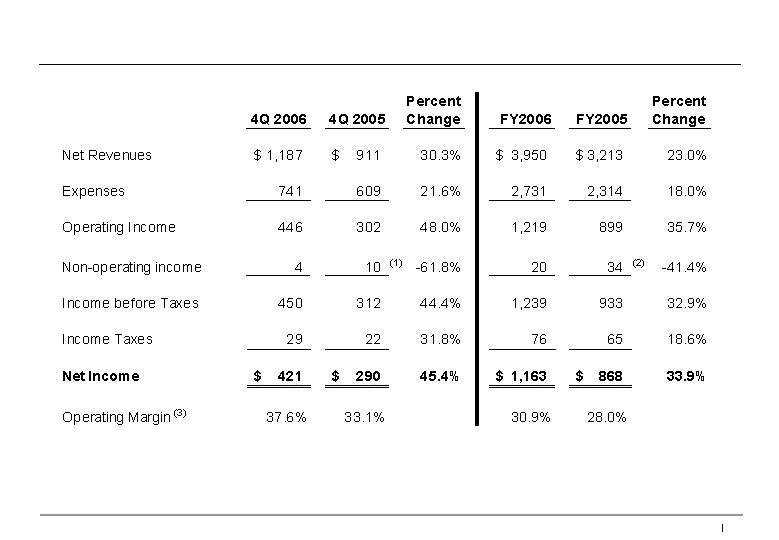
AllianceBernstein
(Operating)
Ø
Net
Revenues up
30.3%
Ø
Operating
Income up
48.0%
Ø
Net
Income up
45.4%
=
AllianceBernstein
Holding distribution of $1.48 per Unit up 45.1%
<
Administrative
error
may result in an adjustment to fourth quarter earnings on the order of
$0.15 per
Unit; substantial recovery of this amount is anticipated
AllianceBernstein
– Fourth Quarter Highlights
3
Fourth-Quarter
2006
Review
Proprietary
–
For
AllianceBernstein L.P. use only
AllianceBernstein
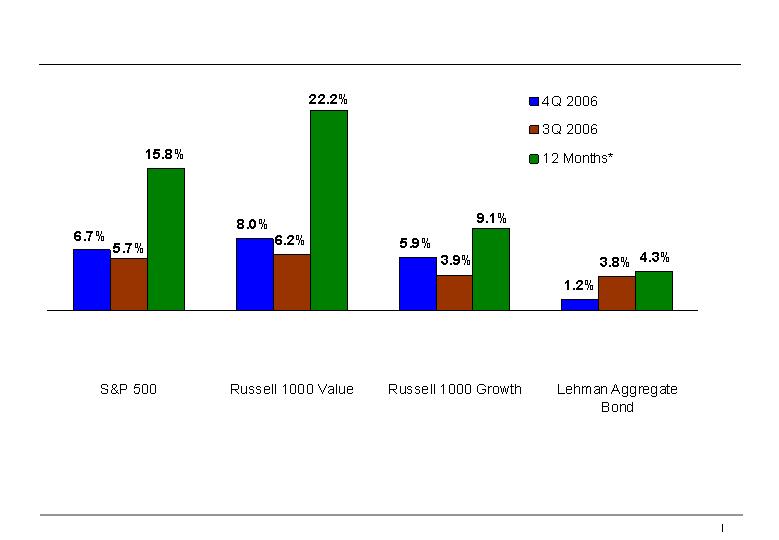
*12
months ending December 31, 2006.
Source:
Frank Russell Company, Standard & Poor’s, and Lehman
Brothers.
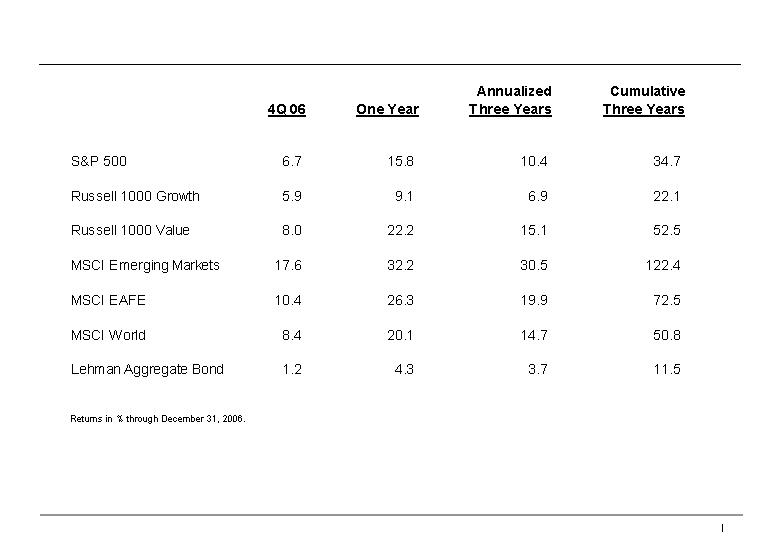
Market
Performance - U.S.
4
Fourth-Quarter
2006
Review
Proprietary
–
For
AllianceBernstein L.P. use only
AllianceBernstein
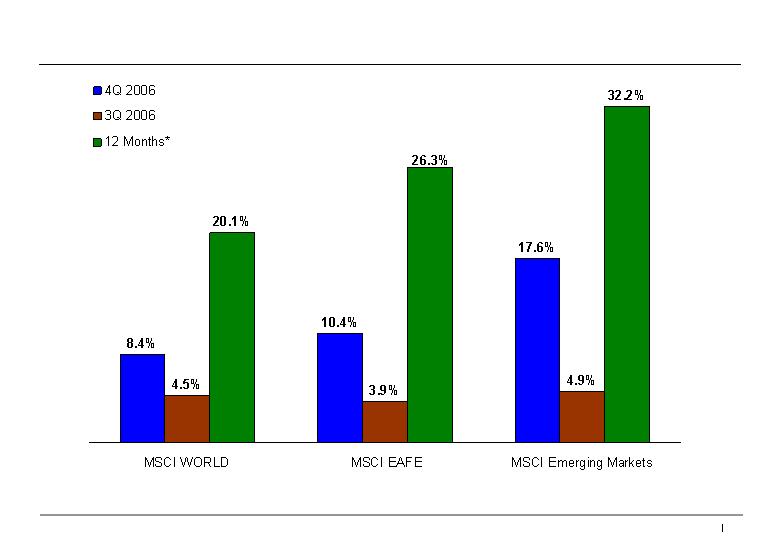
*12
months ending December 31, 2006.
Source:
MSCI (Morgan Stanley Capital International).
Market
Performance - Non-U.S.
5

Fourth-Quarter
2006
Review
Proprietary
–
For
AllianceBernstein L.P. use only
AllianceBernstein
<
Value
Equities
performance was very strong
<
Fixed
Income
outperformed, in some cases substantially
<
Growth
Equities
performance generally weak, but turnaround expected
Relative
Performance Summary
6
Fourth-Quarter
2006
Review
Proprietary
–
For
AllianceBernstein L.P. use only
AllianceBernstein
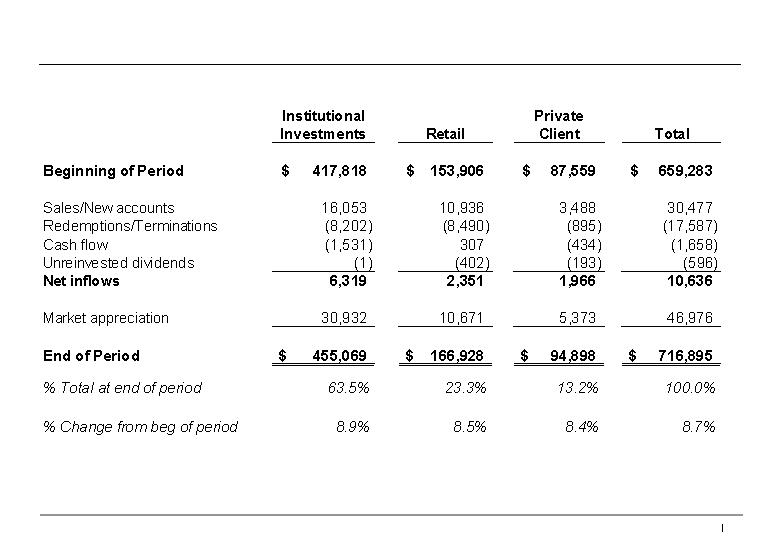
Three
Months
Ended December 31, 2006
In
$ Millions
Changes
in
Assets Under Management
By
Channel
7
Fourth-Quarter
2006
Review
Proprietary
–
For
AllianceBernstein L.P. use only
AllianceBernstein
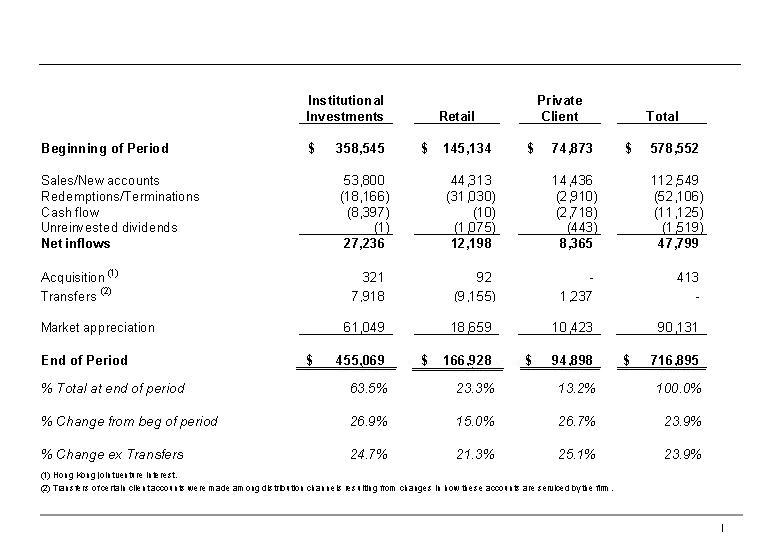
Twelve
Months Ended December 31, 2006
In
$
Millions
Changes
in
Assets Under Management
By
Channel
8
Fourth-Quarter
2006
Review
Proprietary
–
For
AllianceBernstein L.P. use only
AllianceBernstein
Three
Months
Ended December 31, 2006
In
$
Millions
Changes
in
Assets Under Management
By
Investment Service
9
Fourth-Quarter
2006
Review
Proprietary
–
For
AllianceBernstein L.P. use only
AllianceBernstein
Twelve
Months Ended December 31, 2006
In
$
Millions
Changes
in
Assets Under Management
By
Investment Service
10
Fourth-Quarter
2006
Review
Proprietary
–
For
AllianceBernstein L.P. use only
AllianceBernstein
(1)
Transfers of certain client accounts were made among distribution channels
resulting from changes in how these accounts are serviced by the firm.
<
Value
Equity and
Blend Strategies services accounted
for roughly 70% of all new
assets
for roughly 70% of all new
assets
<
Global
&
International services comprised approximately 75% of all new assets
<
Pipeline
of won but
unfunded new mandates remains strong
Institutional
Investments—
Fourth
Quarter Highlights
11
Fourth-Quarter
2006
Review
Proprietary
–
For
AllianceBernstein L.P. use only
AllianceBernstein
(1)Transfers
of certain client accounts were made among distribution channels resulting
from
changes in how these accounts are serviced by the firm.
<
Positive
net inflows
for sixth consecutive quarter
<
Significant
increase
in net asset inflows for full year in:
=
U.S.
Retail mutual
funds
=
Global
&
International and Multi-Strategy services
<
Net
positive flows
in:
=
U.S.
and Luxembourg
funds
=
Equity
and fixed
income
Retail—
Fourth
Quarter Highlights
12
Fourth-Quarter
2006
Review
Proprietary
–
For
AllianceBernstein L.P. use only
AllianceBernstein
(1)Transfers
of certain client accounts were made among distribution channels resulting
from
changes in how these accounts are serviced by the firm.
Private
Client—
Fourth
Quarter Highlights
<
Net
inflows
increased from the third quarter
<
Financial
Advisor
headcount increased to 298 – up 14.2%
from December 2005,
including the opening of our
U.K. office
from December 2005,
including the opening of our
U.K. office
13

Fourth-Quarter
2006
Review
Proprietary
–
For
AllianceBernstein L.P. use only
AllianceBernstein
<
Revenue
growth of
1.9% from prior year quarter and 6.3% for the full year
<
Revenue,
adjusted
for advisory fee reclassification, up 6.1% from prior year quarter and
16.2% for
the full year
<
4Q06
revenue growth
driven by London, with U.S. about flat
<
Client
use of our
algorithmic trading platform in the U.S. continues to grow; on schedule
for 1Q07
launch in Europe
<
Outstanding
results
in Institutional Investor’s “Best U.S. Independents”
survey:
=
Ranked
in 26
sectors, including first place finishes in 23 sectors
Institutional
Research Services—
Fourth
Quarter Highlights
14
Fourth-Quarter
2006
Review
Proprietary
–
For
AllianceBernstein L.P. use only
AllianceBernstein
By
Client
Domicile
By
Investment Service
In
$
Billions
Non-U.S.
UP
44%
Global
&
Int’l
UP
50%
$415
72%
$717
Billion
+24%
at
Dec 31,
2006
Equity
$579
Billion
at
Dec 31, 2005
$164
28%
$540
75%
$177
25%
F/I
Equity
F/I
Growth
in
Global Assets
15
Fourth-Quarter
2006
Review
Proprietary
–
For
AllianceBernstein L.P. use only
AllianceBernstein
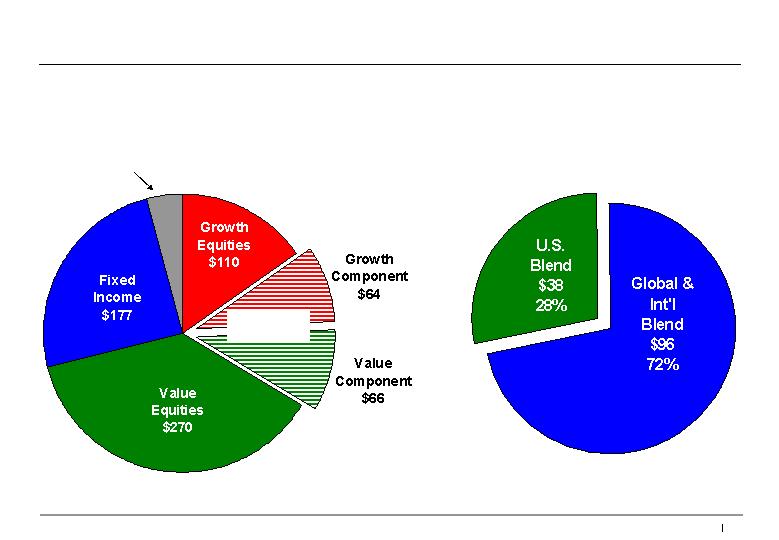
Blend
Strategies
Index/Structured
$30
Assets
Under
Management
by
Investment Service
$717
Billion
Blend
Strategies AUM
$134
Billion(1)
(+52%
vs.
12/31/05)
(1)
Includes approximately $4 billion of Blend Fixed Income AUM.
25%
38%
9%
9%
15%
4%
(1)
In
$
Billions
Growth
in
Blend Strategies Assets
16
Fourth-Quarter
2006
Review
Proprietary
–
For
AllianceBernstein L.P. use only
AllianceBernstein
(1)
Includes
approximately $4 million reclassified from advisory fees.
(2)
Includes
Shareholder Servicing, Investment Gains (Losses) and Other Revenues.
NOTE:
Percentages are calculated using revenues and expenses rounded to the
nearest
thousand.
In
$
Millions
AllianceBernstein
Fourth Quarter Revenues
17
Fourth-Quarter
2006
Review
Proprietary
–
For
AllianceBernstein L.P. use only
AllianceBernstein
NOTE:
Percentages are calculated using revenues and expenses rounded to the
nearest
thousand.
AllianceBernstein
Fourth Quarter Advisory
Fees
18
Fourth-Quarter
2006
Review
Proprietary
–
For
AllianceBernstein L.P. use only
AllianceBernstein
NOTE:
Percentages are calculated using revenues and expenses rounded to the
nearest
thousand.
In
$
Millions
AllianceBernstein
Fourth Quarter Operating Expenses
19
Fourth-Quarter
2006
Review
Proprietary
–
For
AllianceBernstein L.P. use only
AllianceBernstein
NOTE:
Percentages are calculated using revenues and expenses rounded to the
nearest
thousand.
In
$
Millions
AllianceBernstein
Fourth Quarter Compensation &
Benefits
20
Fourth-Quarter
2006
Review
Proprietary
–
For
AllianceBernstein L.P. use only
AllianceBernstein
NOTE:
Percentages are calculated using revenues and expenses rounded to the
nearest
thousand.
In
$
Millions
AllianceBernstein
Fourth
Quarter Expenses
21
Fourth-Quarter
2006
Review
Proprietary
–
For
AllianceBernstein L.P. use only
AllianceBernstein
(1)
Includes $7 million gain on disposition of South Africa J.V.
(2)
Includes $7 million gain on disposition of South Africa J.V. and $8 million
gain
on disposition of Indian mutual funds
(3)
Operating Income as a percentage of net revenues.
NOTE:
Percentages are calculated using revenues and expenses rounded to the
nearest
thousand.
In
$
Millions
AllianceBernstein
Fourth Quarter Net Income
22
Fourth-Quarter
2006
Review
Proprietary
–
For
AllianceBernstein L.P. use only
AllianceBernstein
NOTE:
Percentages are calculated using revenues and expenses rounded to the
nearest
thousand.
In
$ Millions
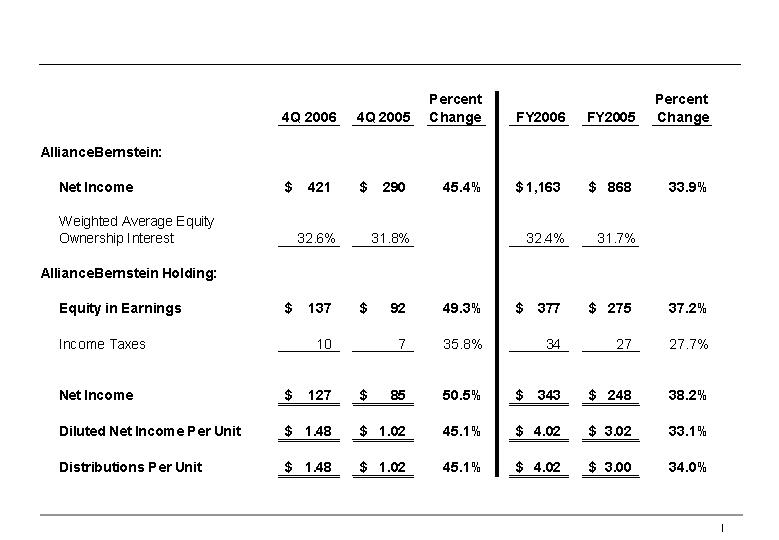
(except per unit amounts)
AllianceBernstein
Holding Financial Results
23

Q&A
24

Appendix
25
Fourth-Quarter
2006
Review
Proprietary
–
For
AllianceBernstein L.P. use only
AllianceBernstein
Market
Environment
26
Fourth-Quarter
2006
Review
Proprietary
–
For
AllianceBernstein L.P. use only
AllianceBernstein
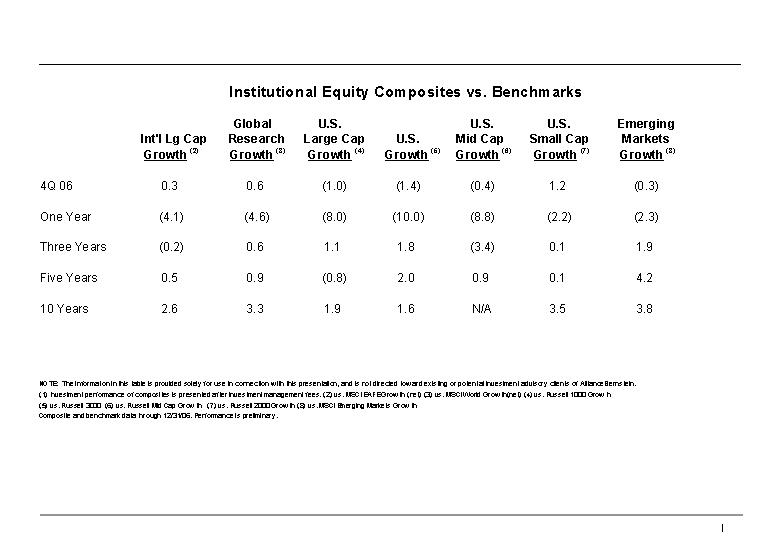
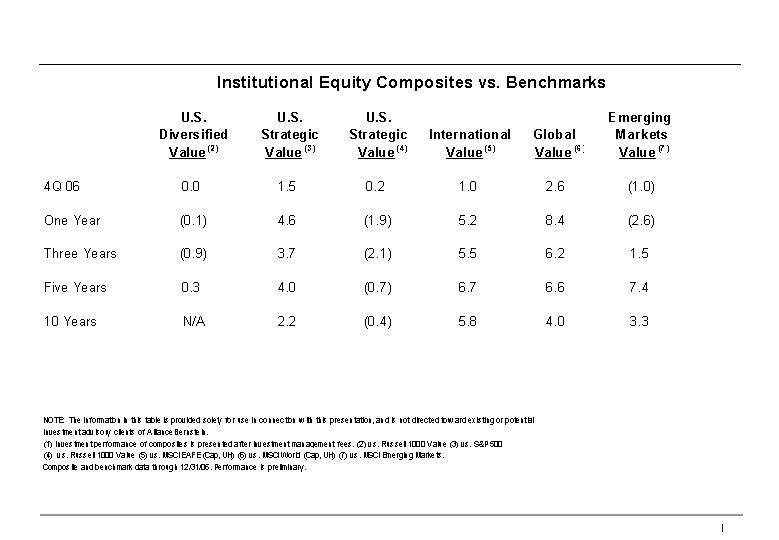
Relative
Performance: Institutional Growth Equity (After
Fees)
(1)
27
Fourth-Quarter
2006
Review
Proprietary
–
For
AllianceBernstein L.P. use only
AllianceBernstein
Relative
Performance: Institutional Value Equity (After
Fees) (1)
28
Fourth-Quarter
2006
Review
Proprietary
–
For
AllianceBernstein L.P. use only
AllianceBernstein
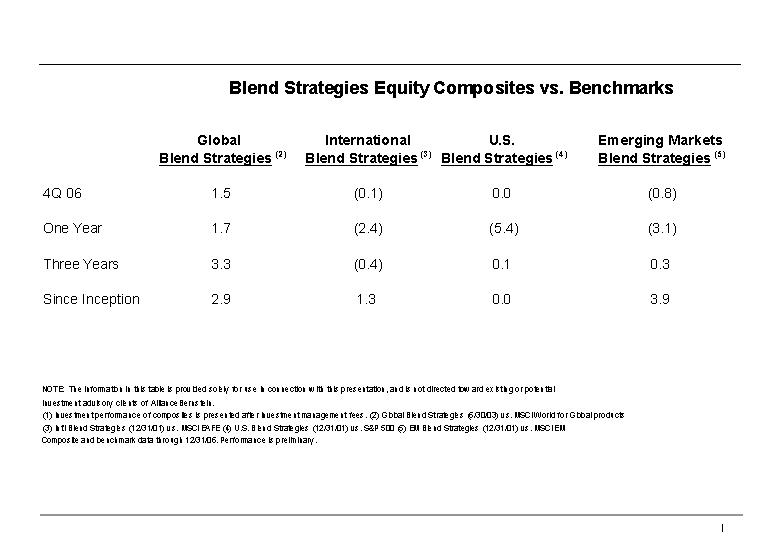
Relative
Performance: Blend Strategies Services (After
Fees)
(1)
29
Fourth-Quarter
2006
Review
Proprietary
–
For
AllianceBernstein L.P. use only
AllianceBernstein
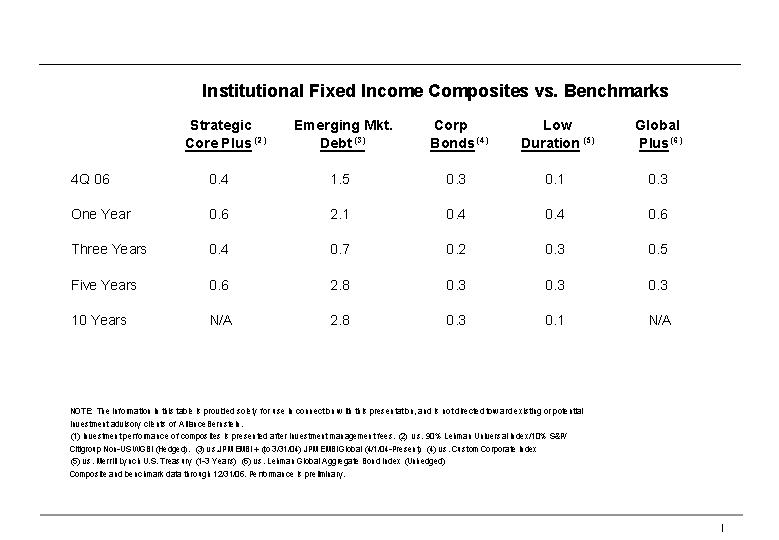
Relative
Performance: Institutional Fixed Income (After
Fees)
(1)
30
Fourth-Quarter
2006
Review
Proprietary
–
For
AllianceBernstein L.P. use only
AllianceBernstein
Absolute
Performance: Private Client (After
Fees) (1)
31
Fourth-Quarter
2006
Review
Proprietary
–
For
AllianceBernstein L.P. use only
AllianceBernstein
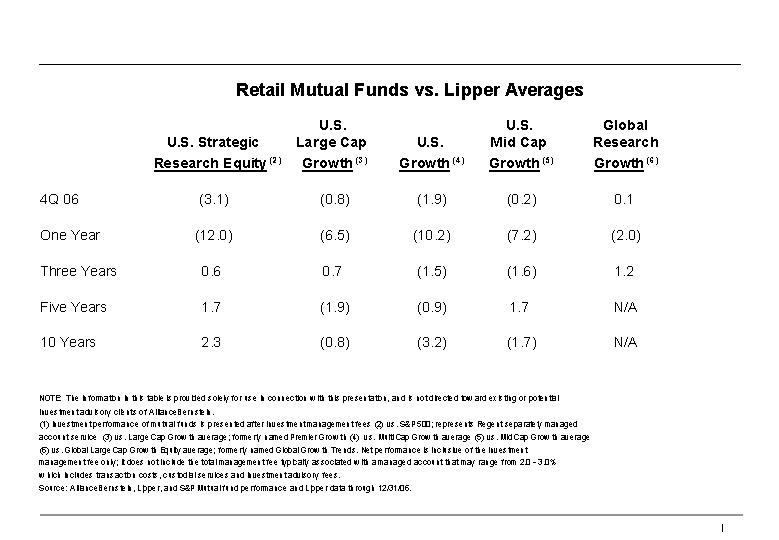
Relative
Performance: Retail Growth Equity (After
Fees) (1)
32
Fourth-Quarter
2006
Review
Proprietary
–
For
AllianceBernstein L.P. use only
AllianceBernstein
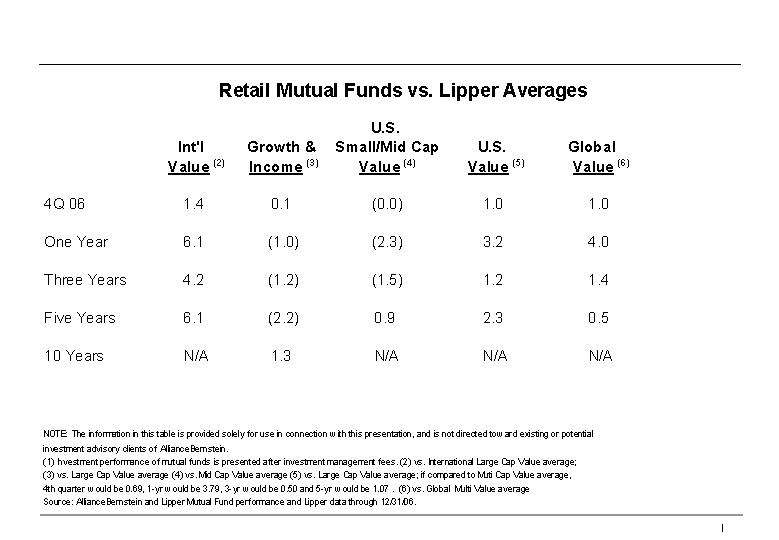
Relative
Performance: Retail Value Equity (After
Fees) (1)
33
Fourth-Quarter
2006
Review
Proprietary
–
For
AllianceBernstein L.P. use only
AllianceBernstein
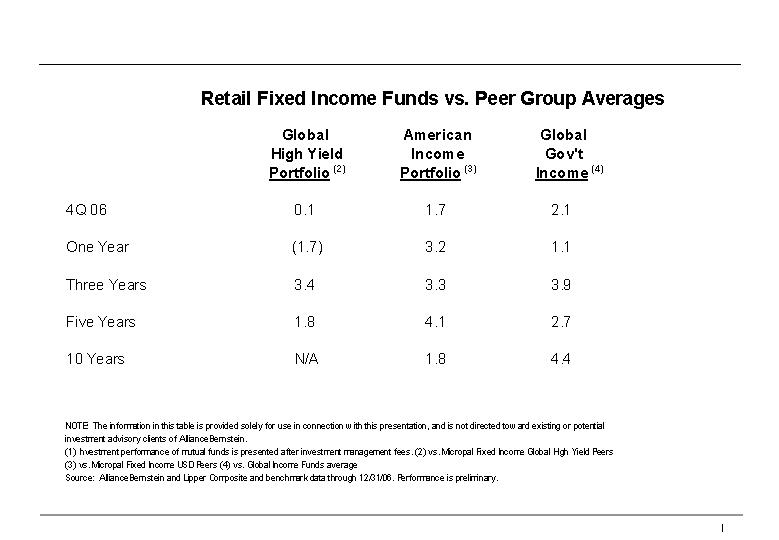
Relative
Performance: Retail Fixed Income (After
Fees) (1)
34
Fourth-Quarter
2006
Review
Proprietary
–
For
AllianceBernstein L.P. use only
AllianceBernstein
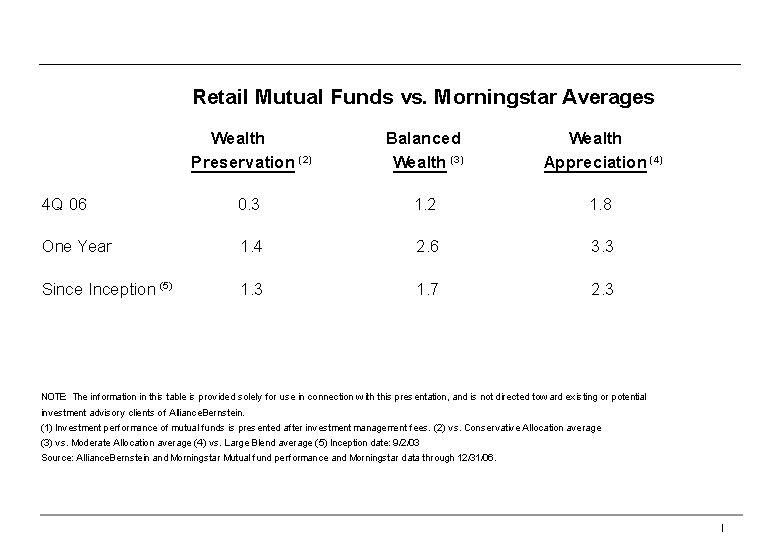
Relative
Performance: Wealth Strategies (After
Fees) (1)
35

Fourth-Quarter
2006
Review
Proprietary
–
For
AllianceBernstein L.P. use only
AllianceBernstein
Bernstein
Value Equities
Inception
Date
Inception–
Dec
2006
Alliance
Growth Equities
Inception
Date
The
performance figures in AllianceBernstein Fixed Income reflect corrections
made
to the original presentation.
The
information in this table is provided solely for use in connection
with this
presentation and is not directed towards existing or potential investment
advisory clients of AllianceBernstein. Past performance is no guarantee
of
future results. Source: Bloomberg, Citigroup, FTSE, JPMorgan Chase,
Lehman
Brothers, Merrill Lynch, MSCI, Nomura, Russell Investment Group, Scotia
Capital,
S&P, TOPIX, and AllianceBernstein.
AllianceBernstein
Style Blend
AllianceBernstein
Fixed Income
Net-of-Fee
Annualized Relative Performance Premiums
Inception–
Dec
2006
Investment
Performance: Delivering Results for Clients
36
Fourth-Quarter
2006
Review
Proprietary
–
For
AllianceBernstein L.P. use only
AllianceBernstein
In
$ Millions
AllianceBernstein
Transaction Fees
37
Fourth-Quarter
2006
Review
Proprietary
–
For
AllianceBernstein L.P. use only
AllianceBernstein
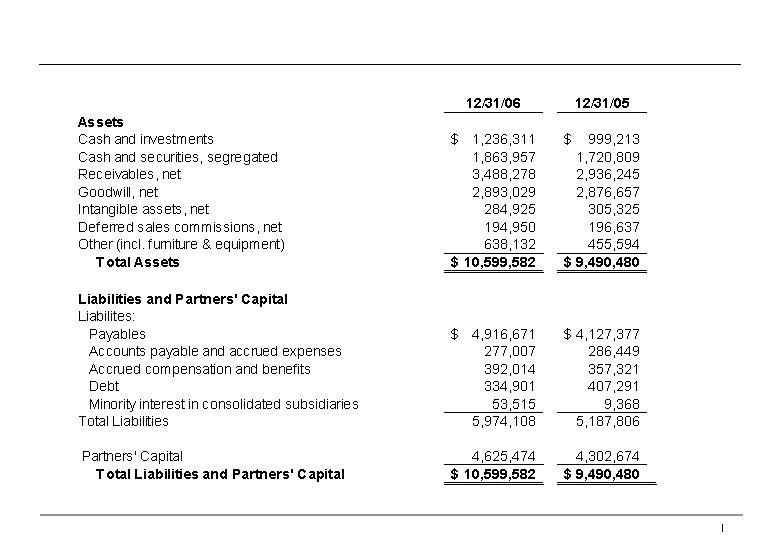
In
$ Thousands,
Unaudited
AllianceBernstein
Consolidated Balance Sheet
38
Fourth-Quarter
2006
Review
Proprietary
–
For
AllianceBernstein L.P. use only
AllianceBernstein
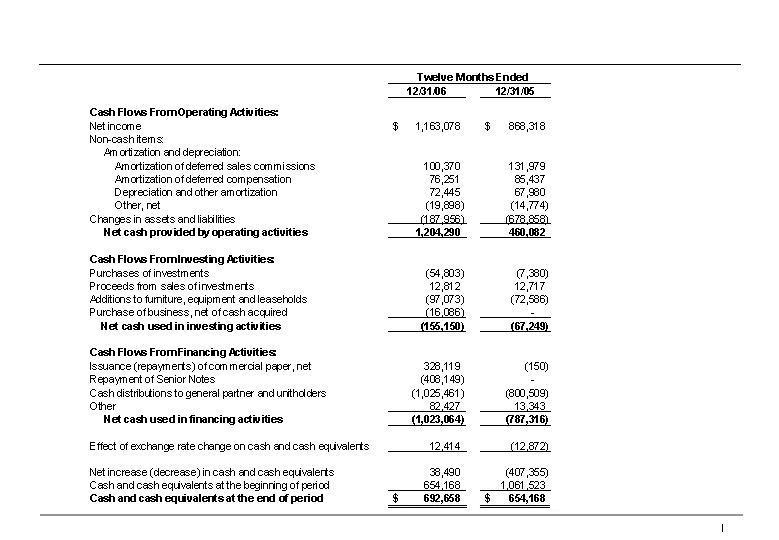
In
$ Thousands,
Unaudited
AllianceBernstein
Consolidated Statement of Cash Flows
39

Fourth-Quarter
2006
Review
Proprietary
–
For
AllianceBernstein L.P. use only
AllianceBernstein
AllianceBernstein®
and the AB AllianceBernstein Logo are trademarks and service marks owned
by
AllianceBernstein L.P.
40
Moderator:
Philip Talamo
January
24, 2007
5:00
p.m. EST
OPERATOR:
Thank you for standing by, and welcome to the AllianceBernstein fourth quarter
2006 earnings review. At this time all participants are in- listen only mode.
After the formal remarks there will be a question and answer session and
I will
give you instructions on how to ask a question at that time.
As
a
reminder, this conference is being recorded and will be archived for one
week. I
would now like to turn the conference over to the host for this call, the
Director of Investor Relations for AllianceBernstein, Mr. Philip Talamo.
Go
ahead.
PHILIP
TALAMO, DIRECTOR OF INVESTOR RELATIONS, ALLIANCEBERNSTEIN: Thank you, Lindsay.
Good afternoon everyone, and welcome to our fourth quarter Earnings Review.
As a
reminder, this conference call is being webcast and is supported by a slide
presentation that can be found on our web site at alliancebernstein.com.
Presenting
our results today is Jerry Lieberman, President and Chief Operating Officer.
Lew
Sanders, our Chairman and Chief Executive Officer and Bob Joseph, our CFO,
will
also be available to answer questions at the end of Jerry’s formal remarks.
I’d
like
to take this opportunity to note that some of the information we present
today
may be forward looking in nature, and as such is subject to certain SEC rules
and regulations regarding disclosure. Our disclosure regarding forward looking
statements can be found on page two of our slide presentation as well as
in the
risk factors section of our 2005 Form 10-K.
In
light
of the SEC’s regulation FD, management is limited in responding to inquiries
from investors and analysts in a non-public forum. Therefore, we encourage
you
to ask all questions of a material nature on this call.
At
this
time I’d like to turn the call over to Jerry Lieberman.
JERRY
LIEBERMAN, PRESIDENT AND COO, ALLIANCEBERNSTEIN: Thank you, Phil, and good
afternoon to everyone on the call. I’ll start today’s call with a few highlights
and then add some additional commentary and texture on the quarter and the
full
year.
Well
it
all starts with investment returns, and the capitals markets produced strong
gains globally, driven by a growing global economy and robust corporate
earnings. From a relative performance perspective, AllianceBernstein’s Value
Equity services continued to outperform their benchmarks and our Fixed Income
services continued their trend of improving performance.
Conversely,
performance in our Growth Equity services materially lagged their respective
benchmarks in the quarter and for the year, although the three, five and
ten
year period returns for these services remain generally competitive.
Our
firm’s organic growth rate was strong for the quarter and the year. We ended the
year with client assets under management of just under $717 billion, an increase
of 23.9 percent for the year, as market appreciation, performance and net
inflows added $138 billion to AUM.
Operating
partnership net revenues were nearly $1.2 billion for the quarter, up 30.3
percent versus fourth quarter ’05, with performance fees a significant
contributor. Operating income was up 48 percent and Net Income increased
by more
than 45 percent to a record $421 million.
Net
income and distribution per unit for AllianceBernstein Holding, the publicly
traded partnership, were a record $1.48, up 45.1 percent versus the fourth
quarter of 2005.
1
Finally,
there is a very recent development that we mentioned in our press release
this
afternoon. This relates to an error that may require a fourth quarter adjustment
to earnings on the order of $0.15 per unit, however, substantial recovery
of the
cost of this error is anticipated. I’ll have more on this later.
Having
covered the highlights for the quarter, I’ll now give you a more detailed
description of our results. As shown on display four, you’ll see that all four
U.S. capital market indices were up significantly for the second consecutive
quarter, with the equity indices posting their best quarter of the year,
and by
the way, their strongest year since 2003. Moreover, the S&P 500’s gain of
15.8 percent was more than 500 basis points ahead of its 15 year
average.
On
display five, you’ll see that non-U.S. capital markets, as represented by the
three MSCI indices, also had an outstanding quarter and year. MSCI Emerging
Markets and MSCI EAFE more than doubled their impressive third quarter returns
and, more importantly, the 12 month returns for all three indices were
spectacular, ranging from 20.1 percent to 32.2 percent. The MSCI EAFE and
MSCI
World indices each recorded their best annual returns since 2003.
Meanwhile
relative returns for our clients for the quarter and, more importantly, for
the
one, three and five year periods in our Value Equity services were extremely
strong, and in some cases, outstanding. This is particularly true in our
global
and international service for institutional and individual clients alike
with
returns as high as 840 basis points higher than respective benchmarks, or
Lipper
averages.
Our
Fixed
Income services have generally done well, in some cases substantially so,
performing above benchmarks for our institutional clients and above Lipper
averages for our individual clients. More importantly, we’re seeing continuing
improvement in the relative performance numbers in our Fixed Income services,
as
investments in research, analytical tools, and portfolio construction are
benefiting our clients.
In
contrast, our relative performance in our Growth services was weak for the
year,
especially in the U.S. With that said, the valuation compression between
the
value and growth components of the capital markets has reached a point where
continued underperformance by growth appears unlikely. We believe our Growth
Services are well positioned to benefit from this change in trend.
With
the
review of absolute and relative market returns as the backdrop, let’s turn to
display seven for a summary analysis of assets on the management by distribution
channel for the three months ended December 31, 2006.
As
you
can see, market appreciation, coupled with strong net asset inflows, resulted
in
AUM growth of 8.7 percent. Net flows for the quarter were approximately $10.6
billion consisting of $6.3 billion in Institutional Investments, over $2.3
billion in Retail, and nearly $2 billion in our Private Client
channel.
Display
eight shows changes in assets under management by channel for the 12 months
ended December 31, 2006. Our AUM increased approximately $138 billion, or
23.9
percent for the year. Net inflows were strong, totaling $47.8 billion for
an
organic growth rate of 8.3 percent, and investment performance added $90.1
billion, or 15.6 percent.
Record
gross sales of over $112.5 billion for the year were nearly 40 percent higher
than 2005’s gross sales. Each channel posted a new record for gross inflows for
a calendar year, with Institutional Investments totaling $53.8 billion, Retail,
$44.3 billion and Private Client, $14.4 billion. Net inflows by channel consists
of approximately $27.2 billion in Institutional Investments, $12.2 billion
in
Retail and $8.4 billion in our Private Client channel.
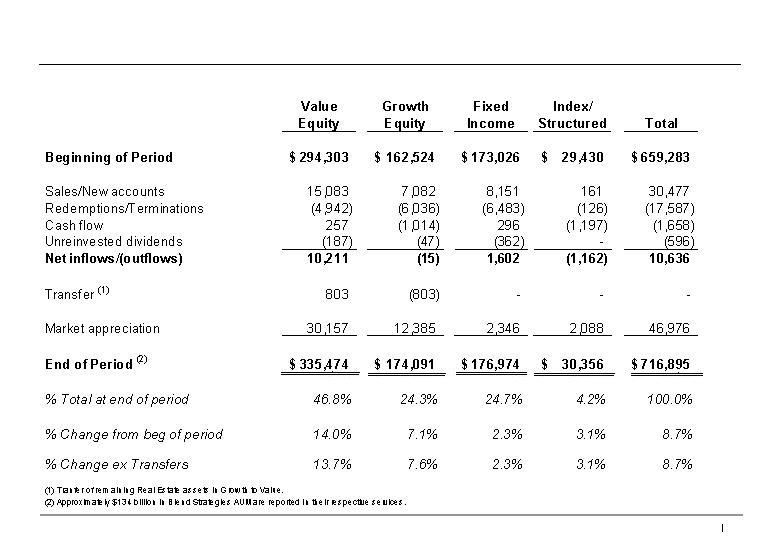
Turning
to display nine, we have the summary of changes in AUM by Investment Service
for
the three months ended December 31. Our Value Equity service was clearly
the
main driver of total inflows for the quarter, with record net inflows of
$10.2
billion. Fixed income had $1.6 billion in net inflows, while our Growth services
were essentially flat.
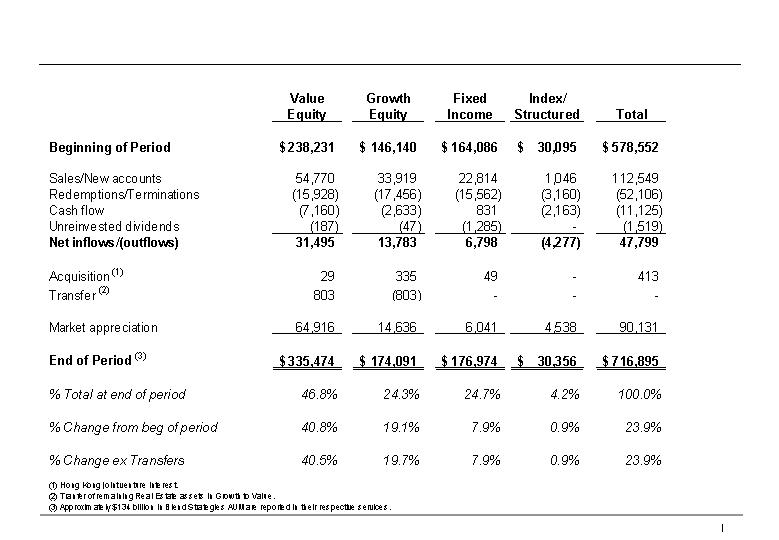
Turning
to display ten, you see for the 12 months ended December 31, Value Equities
again led the way with about $54.8 billion in gross sales, and $31.5 billion
in
net inflows, both new firm records.
2
In
addition, market appreciation of our Value Equity services was nearly $65
billion for a total increase of over $96 billion, or 40.5 percent in 12 months.
Gross inflows for growth equities were almost $34 billion, with $13.8 billion
of
net inflows.
Fixed
income services achieved net inflows of $6.8 billion compared to no net flows
in
2005. With our improving relative performance in fixed income services, we
expect Fixed Income net flows to increase still more in 2007.
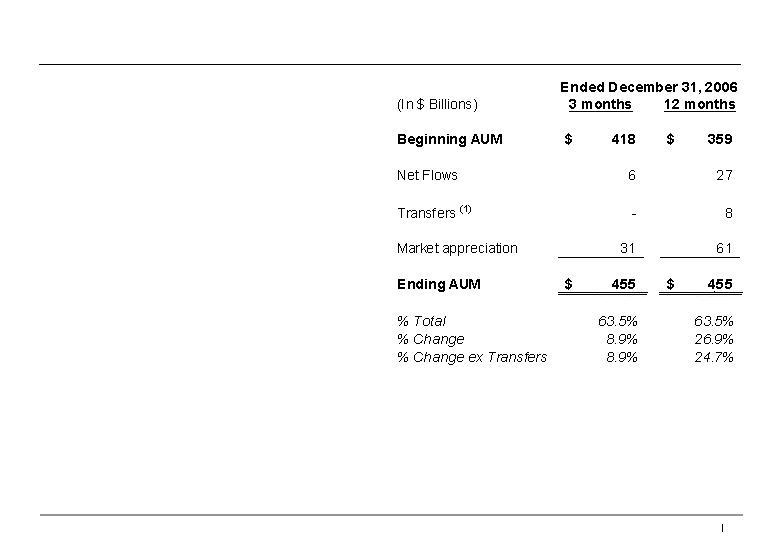
Let’s
turn to display 11 where I start my discussion of our distribution highlights
beginning with our Institutional Investments channel. At December 31, our
Institutional assets totaled $455 billion, or 63.5 percent of our overall
AUM.
The
8.9
percent increase in institutional investments AUM for the quarter was primarily
driven by market appreciation of $31 billion, while net inflows were about
$6
billion as we funded 140 institutional mandates.
During
the fourth quarter, our Value Equity and Blend Strategies services accounted
for
roughly 70 percent of all new assets. Now looking at it from another way,
global
and international services comprised approximately 75 percent of all new
assets
in the quarter, a continuing trend. And lastly, our pipeline of won but unfunded
new institutional mandates remains strong.
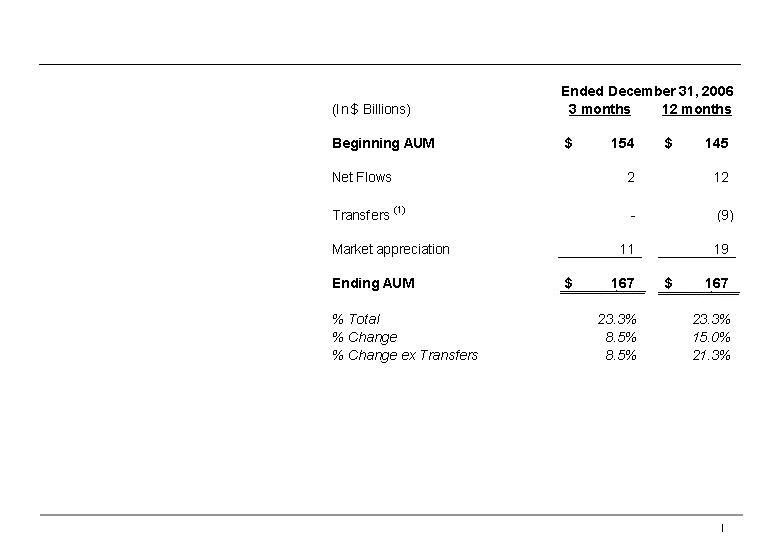
Turning
to display 12, you’ll see that our Retail assets under management are up $13
billion, or 8.5 percent, for the quarter, to $167 billion, and represent
23.3
percent of our total AUM.
As
you
can see, market appreciation accounted for most of the increase in the quarter.
For the full year, net inflows were $12 billion, an organic growth rate of
8.4
percent, which is up, which was our best year since 2000 and compares to
only
$1.1 billion of net inflows in 2005.
The
organic growth came from significant increases in Global, International and
Multi Strategy services. The net flows were across both Equity and Fixed
Income
services and in both our U.S. and Luxembourg funds. Oh yes, 2006 marked the
first year of positive net sales for U.S. retail mutual funds since 2001
and the
sixth straight consecutive quarter for net flows for the channel.
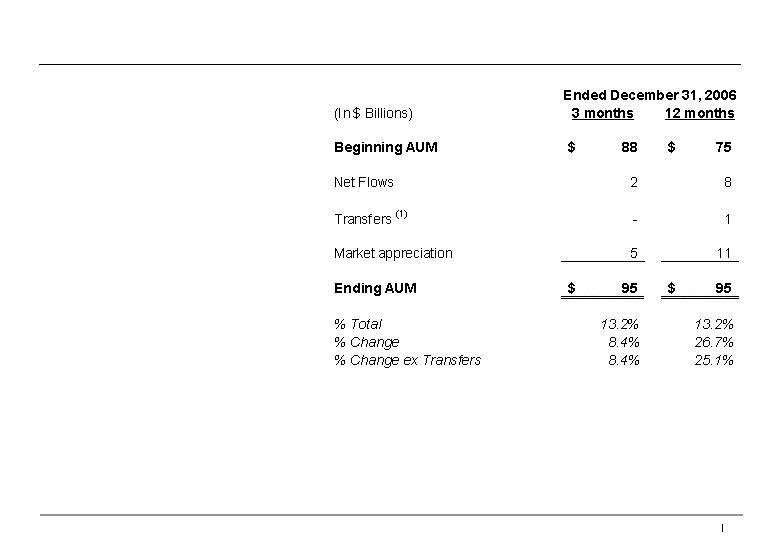
Display
13 shows our Private Client channel highlights. Here you can see that the
assets
of our high net worth clients represent 13.2 percent of our total AUM, as
total
AUM grew by almost 27 percent year- over- year to $95 billion, mostly the
result
of market appreciation and double digit organic growth for the year.
We
continued to invest in our Private Client business as we added 37 financial
advisors, for a total of 298, a 14.2 percent increase over the past 12 months.
Highlights
for Institutional Research Services are shown on display 14. Revenues totaled
$89 million for the quarter, a 1.9 percent increase from a year ago, driven
primarily by European business. However, as shown in the appendix on display
37,
after adjusting for a reclassification of transaction charges associated
with
investment management clients, research revenues actually increased by 6.1
percent versus the prior year quarter and 16.2 percent for the year.
Our
market share improved in the U.S., thanks to strong growth in algorithmic
trading volumes and increased acceptance of our research services. These
gains
were partially offset by pricing pressure and a shift in mix to trading services
having lower revenue yields. Full year revenue grew strongly in our London
based
operations as well, with the fourth quarter run rate recovering from some
weakness in the third quarter.
Also,
during the quarter Institutional Investor released results of their “Best U.S.
Independents” survey, and our performance was excellent. Our analysts ranked in
26 sectors, including 23 first place finishes in the survey.
In
summary, we’re quite pleased with our results for the fourth quarter and the
full year for all four of our channels. The success and continued dedication
to
improving our level of service across all of our distribution channels, coupled
with outstanding performance of our investment services, will further our
progress toward achieving our goal of becoming the most admired investment
firm.
3
Before
I
begin my review of financial results, I’d like to highlight the diversity of our
assets under management. Turning to the center pair of pie charts on display
15,
you can see that we currently have 75 percent of our $717 billion of total
AUM
in Equities, versus 72 percent a year ago, and manage $177 billion in Fixed
Income securities.
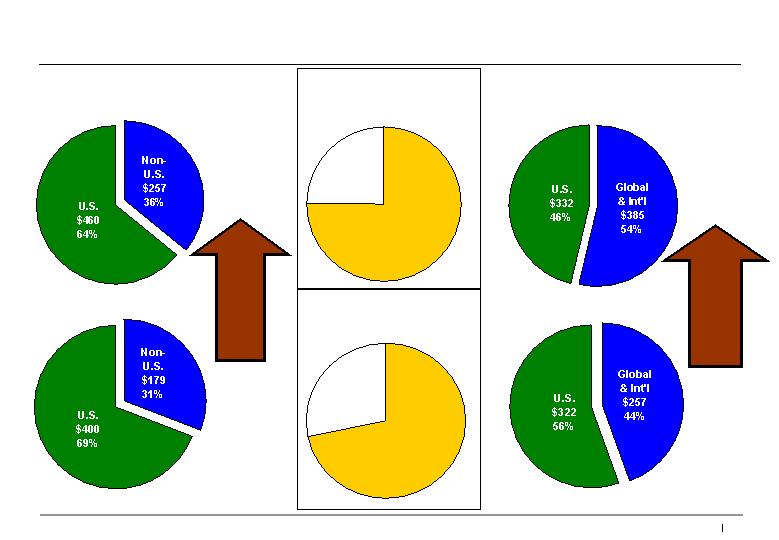
Looking
at the two other sets of pie charts, you’ll note that our firm’s business
continues to become increasingly global from a client domicile and investment
service perspective. The pair of pie charts on the left side of the display
shows that AUM of our non-U.S. domicile clients increased by 44 percent from
December 2005 to $257 billion, compared to the 24 percent increase in total
AUM.
The
right
side of the display illustrates that over the past 12 months our assets in
global and international investment services grew by 50 percent, from $257
billion to $385 billion, resulting in Global and International services now
accounting for 54 percent of the firm’s total assets under management, compared
to just 44 percent just one year ago.
And
finally the pie charts on display 16 highlight the diversity of our investment
services and the growing importance of our Blend Strategies services. Our
Blend
services, which are offered in U.S., non U.S. and global constructions, totaled
$134 billion at quarter end, and are up 52 percent versus 2005.
Now
that
I’ve provided some highlights of the capital markets and our performance, asset
growth, key trends in our distribution channels, and the diversity and changing
nature of our asset mix, let’s turn to our firm’s financial results, starting on
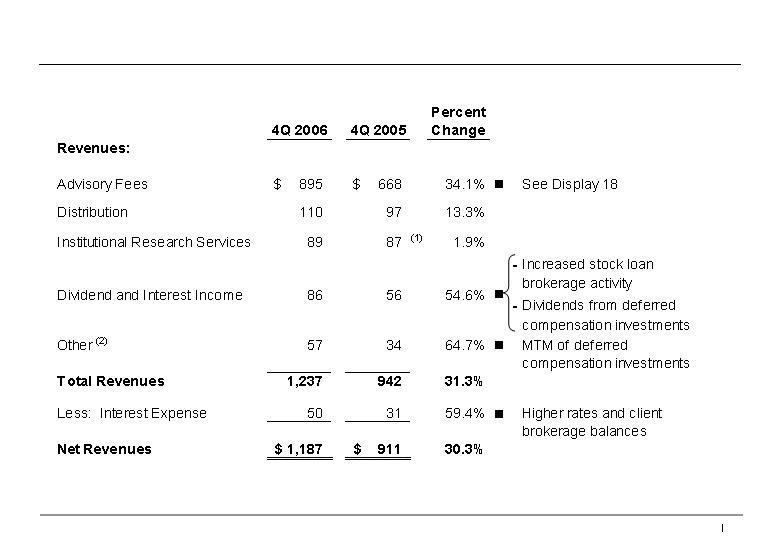
display 17.
Net
revenues for the quarter increased 30.3 percent to approximately $1.2 billion,
a
record for the firm, compared to $911 million in the fourth quarter of 2005.
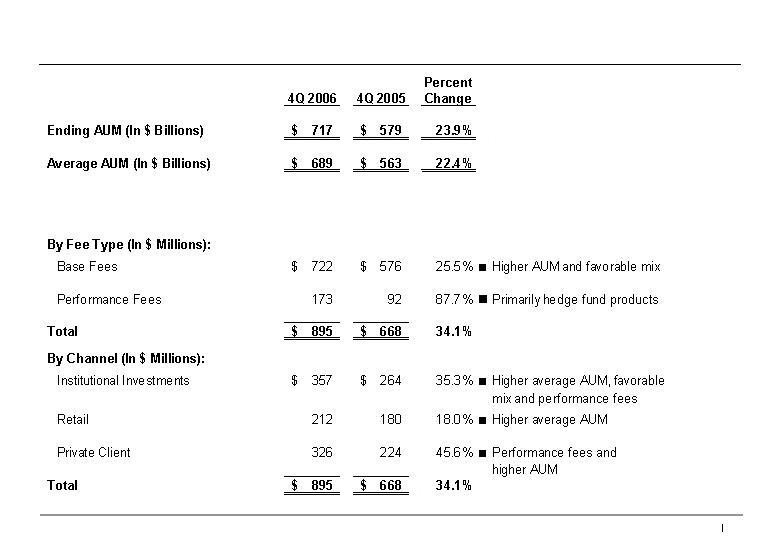
Investment advisory fees increased by 34.1 percent, or $227 million, which
represents 82 percent of the increase in net revenue.
So
let’s
turn to display 18 where we provide additional detail on advisory fees. Here
you
can see base fees were up 25.5 percent or $146 million, versus the prior
quarter, to $722 million. The increase was primarily attributable to higher
average AUM in all three channels, but also to a favorable mix shift to more
value-added, higher-priced investment services. That is, a shift to more
equities, more non-U.S. investment services as well as growth in our Alternative
Investment services.
This
shift manifests itself with higher average fee realizations under investment
services. Another view is to consider the impact as additive to the firm’s
organic growth -- the eight percent rate as measured by cash flows becomes
double digits with respect to base fee revenues when mix shift is included
in
the calculation.
Moving
down to the performance fee line, you can see our firm’s record setting total of
$173 million for the quarter, up $87.7 percent versus the fourth quarter
of
2005. The increase in performance fees represents more than 29 percent of
the
year-over-year increase in net quarterly revenues.
Although
largely hedge fund related, our long-only services accounted for approximately
one third of our performance fees for the year. Performance fees represent
more
than 19 percent of our advisory fees in the quarter, compared to less than
14
percent in the fourth quarter of 2005.
As
our
percent of AUM with performance fees grows, revenue and earning’s seasonality
and volatility may become more pronounced as performance fees amplify the
impact
of investment returns.
With
that
said, though, the $236 million in performance fees for the year represents
just
six percent of our revenues, versus four percent in 2005, and provides us
with
the opportunity to earn significant incremental fees when we deliver for
our
clients.
Moving
to
the lower half of the display, we show advisory fees by distribution channel.
Here you can see the 35.3 percent increase in our Institutional Investments
channel, where higher AUM, a favorable mix change, and performance fees all
contributed to the revenue increase.
4
In
the
Retail channel advisory fees increased 18 percent, benefiting from higher
average AUM during the quarter. While in our Private Client channel, fees
grew
45.6 percent, driven primarily by hedge fund performance fees and higher
AUM, in
that order.
Now,
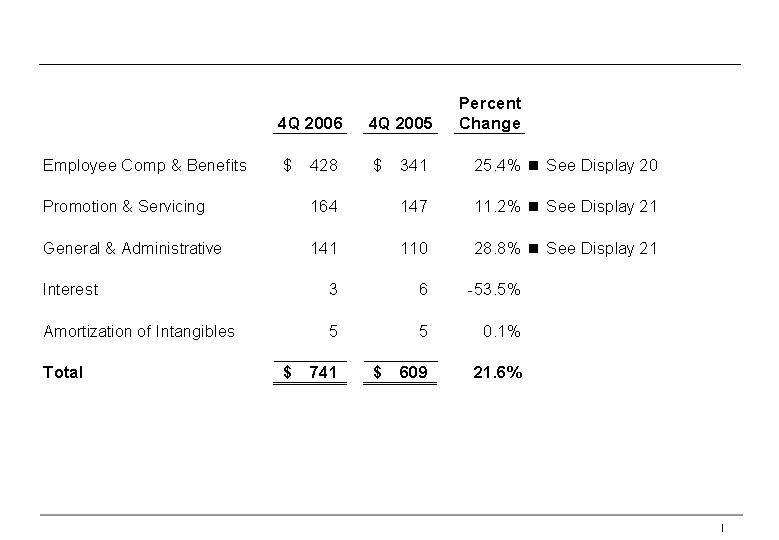
let’s turn to expenses which are summarized on display 19. The 21.6 percent
growth in operating expenses for the quarter is significantly lower than
the
30.3 percent increase in net revenues and resulted in a 450 basis point
improvement in our operating margin in the quarter.
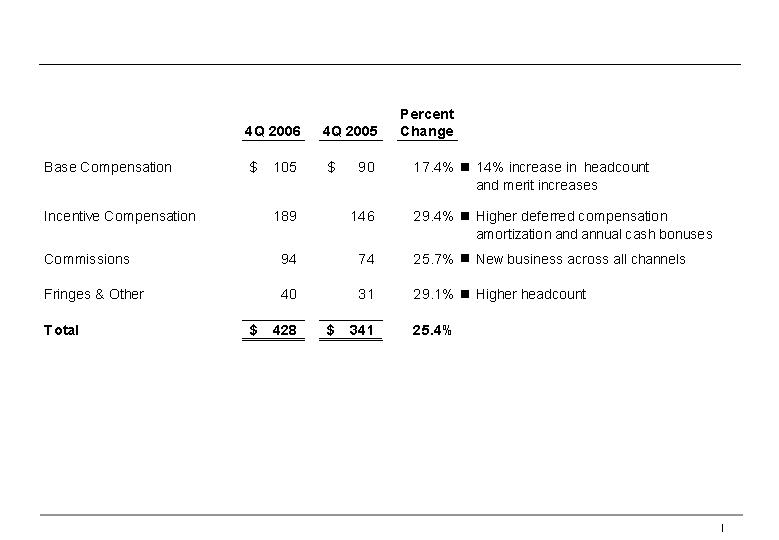
Display
20 provides additional detail on Employee Compensation and Benefits. The
25.4
percent, or $87 million, increase to Employee Compensation and Benefits
represents almost two thirds of the increase in total operating expenses
versus
the fourth quarter of 2005. Base compensation is up 17.4 percent versus last
year as we increased head count by 14 percent, or more than 600 staff members,
to 4,914 at year end.
As
I
mentioned last quarter we have increased head count in operations in response
to
the growth in volume and the increasingly complex, global nature of our firm.
Additionally, in our Retail channel we’re investing to expand distribution
capacity in the U.S. and our infrastructure outside the U.S.
In
our
Private Client channel we continue to increase our global Financial Advisor
staff levels and we’re also investing in operations and technology to support
the expansion of our platform and improve operational functionality and
efficiency.
The
increase in the Incentive Compensation of 29.4 percent, which is significantly
less than our 48 percent operating earnings increase, is attributable to
an
increase in Deferred Compensation and higher earnings, which drives annual
cash
bonuses.
Commission
Expenses increased 25.7 percent, with increases in all distribution channels.
We
should remember that growth in commission expense is actually a leading
indicator for future revenue and earnings because the full impact of new
business isn’t reflected in the current P&L, since commission schedules are
generally front loaded in the first year of the sale.
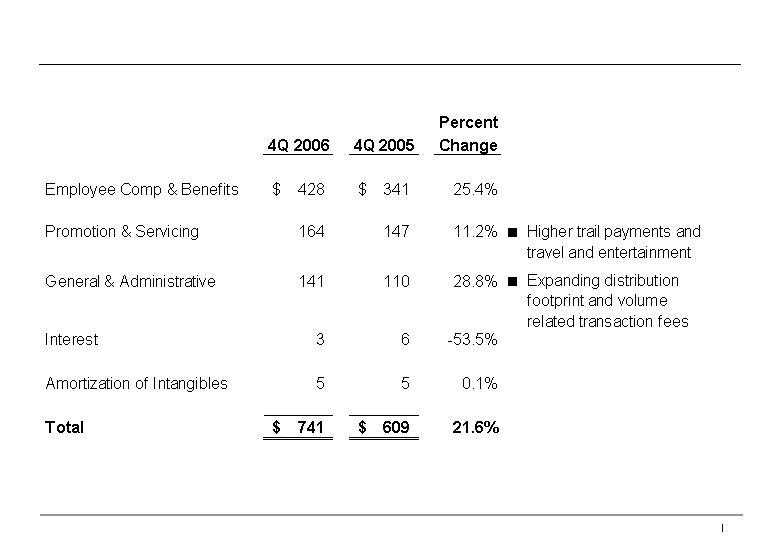
Turning
to display 21, please note that our Promotion and Servicing line includes
the
Amortization of Deferred Sales Commission, which, as shown in this afternoon’s
press release, was $28.7 million for the fourth quarter.
I’d
like
to point out that the $28.7 million includes a cumulative catch up adjustment
of
a prior period amortization that increased the expense by approximately $4
million. So considering the impact of this adjustment, you’ll arrive at a more
appropriate run rate for at least the next few quarters.
Also
on
display 21 you can see the G&A increase of $31 million, or 28.8 percent.
Expanded space in New York City and several U.S. Private Client offices,
as well
as new offices in London, Shanghai and Hong Kong accounted for approximately
one
third of this increase, while volume related transaction costs accounted
for
another third.
As
I wrap
up my comments, please turn to display 22 where we present a summarized income
statement for AllianceBernstein for both the quarter and the full year periods.
Operating margins expanded by 450 basis points for 37.6 percent for the quarter
and 290 basis points for 30.9 percent for the year.
Margins
benefited significantly from the increase in performance service fee revenues
in
both the fourth quarter and the full year and a moderation in our cash incentive
compensation growth rate.
Carrying
the Operating Partnership’s fourth quarter and full year Net Income forward to
display 23, we show that AllianceBernstein’s Holding’s financial results.
Holdings’ share of AllianceBernstein’s earnings were $137 million for the fourth
quarter, versus $92 million in the same quarter last year, resulting in Net
Income of $127 million or 50.5 percent better than ’05.
For
full
year 2006, Net Income totaled $343 million versus $248 million in 2005, an
increase of 38.2 percent. As I mentioned in my opening remarks, Distribution
per
Unit for AllianceBernstein Holding will be $1.48, more than 45 percent higher
than the $1.02 distribution in the same quarter last year. Additionally we’ll be
distributing $4.02 to our unit holders for 2006, a record for the firm.
5
As
noted
earlier, we very recently discovered a clerical error in processing claims
for
class actions settlements on behalf of clients. The guidance we are providing
on
the cost of this error is based on very preliminary data. More complete
information is necessary before we can establish a reserve for this matter.
As
such, an adjustment to the fourth quarter 2006 earning may be required. We
do
anticipate, however, that the bulk of the cost of this error will ultimately
be
recovered from available settlement proceeds and/or insurance.
In
summary, this was a very good quarter capping off a very strong year for
our
firm. A favorable capital market environment, solid relative returns and
our
continued success in generating organic growth through the significant increase
in our assets under management.
Our
AUM
became increasingly global for both the services and client domicile
perspective, both the quarter and full year saw several records being set,
including AUM, asset flows , revenue and Net Income.
Performance
fees increased 88 percent versus the prior year quarter, the result of superior
alpha generation for our clients, as well as significant organic growth in
both
long only and long/short services that include a performance fee component.
Let
me reiterate that our performance fees are and will continue to become an
increasingly important part of our business, they are by nature seasonal
and
volatile and thus very difficult to predict.
Meanwhile,
we continue to make long term investments for the future and as always, all
of
our financial successes are the result of providing superior service to and
meeting the investment objective of our most important stakeholders; our
clients.
And
now,
we'll take your questions.
OPERATOR:
Thank you. At this time, I would like to inform everyone if you would like
to
pose a question at this time, please press star then the number one on your
telephone keypad.
Also,
I
would like to inform you that management has requested that you please limit
your initial questions to two in order to provide all callers an opportunity
to
ask questions. We welcome you to return to the queue to ask follow up
questions.
It
is
AllianceBernstein's practice to take all questions in the order in which
they
were received and to empty the queue before ending the call. Your first question
is coming from Niamh Alexander from CIBC. You may go ahead.
NIAMH
ALEXANDER, ANALYST, CIBC: Thank you so much, great quarter. I just had a
question on the compensation. If I back out the performance, the incentive
compensation it still looks like there was a bit of a true up in the fourth
quarter, or am I reading that incorrectly.
And
then
the other thing is on the incentive comp, you mentioned earlier there was
a
moderation in how it was calculated. Can you expand on that, just so we
understand and maybe it's lower than the new basis for calculating it going
forward, thanks.
JERRY
LIEBERMAN: Let me answer the second piece first. Historically we have increased
our incentive compensation pool in concerts with the increase in operating
earnings, in this year, as I mentioned in the call, the growth in operating
earnings exceeded the amount of bonuses that we paid out to the
staff.
The
first
part of your call, as far as a true up - there's no true up anywhere. There
was
no true up.
NIAMH
ALEXANDER: OK. So I guess the core comp line just grew with the growth in
the
staff and the business then?
JERRY
LIEBERMAN: Exactly.
6
NIAMH
ALEXANDER: OK.
NIAMH
ALEXANDER: That's fair. And then if I could just go back to the pipeline
and my
second question, the pipeline with regards to the…
JERRY
LIEBERMAN: Institutional.
NIAMH
ALEXANDER: Institutional business.
JERRY
LIEBERMAN: Yes.
NIAMH
ALEXANDER: I'm just wondering if, you know, as well as kind of looking at
a
healthy pipeline, if you could help us frame it where it was relative to
the
beginning of last year because you did have those record flows last year,
and
then I guess just in context, are you also kind of hearing more about maybe
some
rebalancing of potential Institutional flows?
JERRY
LIEBERMAN: As far as the pipeline, we’ve had a couple spectacular peaks over the
last two years, but this is a very solid number now and probably pretty much
where we were a year ago, certainly where we were a quarter ago when you
saw
those lists.
LEWIS
SANDERS: This one was higher.
JERRY
LIEBERMAN: Yes, I mean if anything, it’s slightly higher, all right. Lower from
our absolute peak but trending up for the firm.
NIAMH
ALEXANDER: OK.
JERRY
LIEBERMAN: And -- I’m sorry, the other question?
NIAMH
ALEXANDER: I’m sorry, I was just wondering if you’ve heard any feedback or got
any from clients yet about maybe some rebalancing because you’ve had such a
strong year.
JERRY
LIEBERMAN: No, we have -- we haven’t at all.
UNKNOWN
FEMALE: OK, that’s great. Thanks so much.
OPERATOR:
Thank you, your next question is coming from Bill Katz from Buckingham Research.
You may go ahead.
BILL
KATZ, ANALYST, BUCKINGHAM RESEARCH: OK, thank you and good evening everybody.
I
want to stay on sort of the comp question for just one second. Jerry briefly
answered the question. Has there been sort of a structural change in the
methodology to which you’re paying out incentive compensation or was just 2006
an exceptional year?
JERRY
LIEBERMAN: No, I think that quite frankly we had enough -- we felt that we
were
able to pay our staff fairly and competitively and appropriately with what
we
paid out and with this extraordinary increase in earnings, we just didn’t need
to pay out more, so nothing more than that.
If
next
year’s earnings increase is smaller and competitive pressures are appropriate,
then we’ll pay out what we think is appropriate.
BILL
KATZ: OK, just a clarification for my next question. On the performance fees,
is
there any structural difference in the compensation payout relative to sort
of
base earnings?
JERRY
LIEBERMAN: Absolutely not. That’s a practice that we stopped several years
ago.
7
BILL
KATZ: OK.
BILL
KATZ: Our bigger question maybe, Lew, you can provide your thoughts as well.
If
you think that we might be sort poised for a more aggressive shift in style.
Does the relative return of your growth platform broadly -- are there any
issues
there and you sort of look the -- saw that sheet that summarized the growth
platform and there are a lot of sort of brackets around the numbers and I’m just
sort of curious that -- would you be marginalized in any way if there was
something that was more decisive today in a turn?
LEW
SANDERS: Well, I think you can read the data as well as anyone on that score.
I
would say that our growth services are truly style-pure and to the degree
that
there is a performance headwind confronting the style as there was to an
exceptional degree in ’06, you can anticipate our returns will amplify that
negative effect and they indeed did, especially in the United
States.
On
the
other hand, the pressure of last year notwithstanding, our trailing returns
remain competitive and I might add that our standing with the consulting
community, which as you know is quite granular in its assessment of the
competency of the Managers they review, is strong. So, to the degree that
interest in growth services grew broadly, I think we would
participate.
I
might
add that if history is a guide, however, one shouldn’t anticipate that in the
period immediately ahead because there has typically been, as you know, a
pretty
substantial lag between the revival of the style and the cash flows that
accrued
to it.
BILL
KATZ: OK, thank you very much.
OPERATOR:
Thank you. Your next question is coming from Robert Lee from KBW. You may
go
ahead.
ROBERT
LEE, ANALYST, KBW: Thanks. Good afternoon. Quick question. I’m just curious if
the clerical error and possibly having to establish a reserve and in the
past
when you’ve had to take a charge up the reserve up that’s actually impacted the
cash distribution in that period or afterwards? Would -- should we -- if
that
happens, would we expect something similar next year?
JERRY
LIEBERMAN: No, we don’t suspect that will be the case at all, Robert. As we
mentioned -- first of all, this is very preliminary so we’re in the process, but
we do expect to recover this either through the settlement process or through
our insurance, so we do not expect to change the timing of the
distributions.
Actually
we think it would be wrong to do so. We’d be shifting the gains -- the earnings
that we had and for the shareholders and unit holders today to unit holders
of
the future -- it would just be wrong.
ROBERT
LEE: OK and Lew, I’m just curious, I mean, you had the -- you know, the huge
increase in performance fees which you attributed to -- directly to hedge
funds.
Are you -- how much of this is related to the growth and underlying assets
there
may be related to your -- the initiatives you talked about in the other quarter
about ramping up that business and becoming more aggressive in your hedge
fund
products.
Are
you
start -- is it actually starting to see some flow-through of assets there
or is
this just you haven’t even gotten to that point yet?
JERRY
LIEBERMAN: It’s both. The performance was spectacular in the hedge funds and we
are seeing an increase in our in the AUM in the hedge funds.
LEW
SANDERS: I would refer you to the data we reported in the third quarter.
It’s
presented a history of AUM and the hedge funds and it traces very strong
growth.
ROBERT
LEE: OK, thank you.
LEW
SANDERS: Growth which continued, by the way in the fourth
quarter.
8
OPERATOR:
Thank you. Your next question is coming from Cynthia Mayer from Merrill Lynch.
You may go ahead.
CYNTHIA
MAYER, ANALYST, MERRILL LYNCH: Hi, good afternoon.
JERRY
LIEBERMAN: Hi, Cynthia.
CYNTHIA
MAYER: I’m wondering if you could talk a little about institutional research
services. I think last quarter you characterized the decline in revenues
there
as a blip, but it looks like it’s flat from there, so is this a new run
rate?
JERRY
LIEBERMAN: No, I don’t think so, but you know, December typically is just a bad
month for this business, so I -- there’s some -- there’s a little bit of
seasonality here, but year-over-year, the revenues are up we think nicely
and
no, we don’t think we have a problem there.
LEW
SANDERS: Also Cynthia, you know from your observations that, quarter-to-quarter,
this business manifests surprising amount of volatility, so I don’t think you
should draw too much from fourth quarter results. We’re actually pretty pleased
with the year-on-year gains, which were substantial both here in the United
States as well in our London-based operations.
CYNTHIA
MAYER: OK and just also on the clerical error, I’m just wondering if you could
give a little more color on that. What went wrong, was that a particular
Class
Action that you were handling for mutual fund shareholders or something like
that?
JERRY
LIEBERMAN: We’re still gathering and analyzing the information and we feel a
little uncomfortable about being more specific at this time, but it did have
to
do with making claims on the Class Action suit, that we were late in submitting
the claims.
CYNTHIA
MAYER: OK, great. Two questions only, right.
JERRY
LIEBERMAN: Yes, you come back Cynthia. We’re here.
OPERATOR:
The next question is coming from Christopher Spahr from Prudential. You may
go
ahead.
CHRISTOPHER
SPAHR, ANALYST, PRUDENTIAL: Good afternoon. Quick question on modeling. Your
weighted average equity ownership interest has been trending up for the past
two
years and I’m just wondering, should we kind of build in a few extra basis
points and in going -- quarters going forward or is it -- when does it reach
a
steady run rate?
JERRY
LIEBERMAN: Are you referring to Holding’s share of the operating
partnership?
CHRISTOPHER
SPAHR: Yes.
LEW
SANDERS: Yes, as a function of option exercise, I think you can anticipate
that
that will continue to trend up slowly.
CHRISTOPHER
SPAHR: And then also, just the tax rate was a little bit lower -- the effective
tax rate was a little bit lower this quarter, also related to the Holding
share?
LEW
SANDERS: No, you’re looking at Holding. Remember that the tax rate in Holding
isn’t related to income
CHRISTOPHER
SPAHR: Yes.
LEW
SANDERS: It’s related instead to revenue and to the degree then that operating
margins are expanding, the tax rate will fall.
9
CHRISTOPHER
SPAHR: I got you, all right. Thank you.
OPERATOR:
Your next question is a follow-up question from Bill Katz. You may go
ahead.
BILL
KATZ: Hello, maybe Bob, you can chime in on this as well. In the revenue
and the
expense line, I’m sort of curious, the dividend and interest income, I presume
is a function of -- the jump sequentially is a function of sort of the year-end
cleanup, but have we reached a new level or expect that to trend down and
conversely on the G&A line, is the 141 a new run rate or was there also some
sort of year-end cleanup that might peter out a little bit as we go into
the
first quarter?
JERRY
LIEBERMAN: There are two issues here. Let’s start out with dividend and income.
There’s some seasonality in that line because mutual funds tend to pay out a lot
of dividends in the fourth quarter, so that -- there’s some seasonality for that
and then let’s be careful when you’re looking at interest and expense in regards
to our brokerage business, which we started grossing up, I think it was one
quarter ago or maybe it was two, all right, and so you have to look at those
numbers then on the interest and interest lines, Bill.
BILL
KATZ: but I’m saying …
JERRY
LIEBERMAN: There’s nothing unusual going on here at all.
BILL
KATZ: OK, now on the G&A side, sort of curious Jerry, if the 141 is a new
run rate given all the investments, or was there -- taking advantage of the
year-end revenue strength to sort of maybe accelerate some expenses that
maybe
…
JERRY
LIEBERMAN: No, no, no. There’s nothing being accelerated. You could look at this
as a run rate. What’s driving some of this, as I mentioned, it’s actually --
some of this is being driven by the increase in the business actually on
our
sell side because we have transaction fees that end up being recorded on
that
line.
As
the
volumes increase in our business, it’s been driving an increase and -- in the
volume and on some of the increase transaction costs even on the buy side
and
the space stuff, it’s you know, we don’t come up with an office in London,
that’s the most now expensive space in the world. That’s for our private client
office, that’s embedded in there, so there’s nothing accelerated, there’s
nothing being dumped in.
These
are
pretty much run rates.
BILL
KATZ: Great, thank you.
LEW
SANDERS: Hey Bill, I just want to add on space, remember that there won’t be, in
’07, any material new expansion in our physical infrastructure and so, the
continued growth of the business holds some potential to more completely
absorb
that cost.
BILL
KATZ: Do you feel the same way -- I think last quarter, Lew, you had mentioned
that -- and I think it was the first time that you had said this in quite
awhile
-- seem to ask the same question every quarter, that you could see some --
maybe
simplicity to your answer just now. Could you see some margin expansion,
I guess
normalizing for performance fees this quarter, but could we see structurally
an
upward bias to margins, given what seems to be a slowing investment spending
cycle as well as the revenue mix shift you’ve been talking about?
LEW
SANDERS: Well I, you know, that calls for forecast, Bill, but I think you
can
see in our results for ’06, that if we deliver for our clients and the capital
markets are favorable, that there is meaningful operating leverage in the
company.
BILL
KATZ: OK, wonderful. Thank you.
OPERATOR:
Thank you, your next question is coming from Mark Irizarry , from Goldman
Sachs.
You may go ahead.
10
MARK
IRIZARRY, GOLDMAN SACHS: Oh, great, thanks for taking my question. My first
question is on your fixed income flows. The -- it looks like your redemptions
picked up during the quarter. Maybe you could speak to that somewhat and
is, you
know, that part of Jerry, your comment about kind of flows continuing in
’07.
I
mean,
is it partly the uptake the result of robust pipeline or less expectations
of
redemptions? Thanks.
JERRY
LIEBERMAN: that negative number was just a CDO that terminated. There’s nothing
eventful about that, it’s not a client dropping us or a termination, or anything
like that and with the improved performance and we see -- the way the calls
are
going with prospects and clients and consultants, we feel very good about
future
flows in these services.
MARK
IRIZARRY: OK, great, and maybe Lew, this is a question for you. Notwithstanding
kind of any style shift, what can you do that’s in, you know, under your control
of your own destiny, if you will, to kind of help improve performance on
the
growth side? Thanks.
LEW
SANDERS: Well, we have a wide range of initiatives here, Mark, that you’re
familiar with and expanding our research footprint and initiatives around
research innovation that are directed specifically at growth services as
well as
an increased investment in quantitative methods, which I think holds substantial
promise for alpha generation in that domain.
We’re
actually, in most cases, they are rarely applied, so we feel as if we’re taking
the appropriate action to benefit when that style headwinds finally dissipate.
I
will add, as the press release itself indicated, that the valuation structure
of
growth equities as compared to value, is reflecting now many consecutive
years
of under-performance at style, is at an unusually compressed state and while
that doesn’t ensure a recovery in growth, it does suggest that the headwinds
that have been so strong against this style will ameliorate and on that basis
that we think investment returns, both absolute and relative, will
improve.
OPERATOR:
Thank you, your next question is a follow-up question from Niamh Alexander
from
CIBC. You may go ahead.
NIAMH
ALEXANDER: Thanks for taking my question again. If I could go back to your
discussion about investment in the expanding of the distribution capacity
in the
U.S., I understand you were referring primarily to retail there.
Can
you
expand a little bit more on that, because I understand you’ve had kind of a
different strategy and a different approach -- to really trying to differentiate
your product and your pitch to your competitors with the retail
distributors.
JERRY
LIEBERMAN: So you -- what happened is, as we were repositioning this channel,
going back almost three years now, we actually downsized it quite a bit and
now
we’re back into investing and staffing up in additional salespeople and
wholesalers that have been trained in the new positioning of the franchise
and
we just -- we’ve built that up in the course of the years or mostly commissioned
salespeople and we’re -- we now, you know, really ready to go out and we think
make a -- get our message out to our clients and our wholesalers.
LEW
SANDERS: Actually I think I would ask you to ask that question again. Perhaps
you won’t have to at the next quarterly conference call, where we might be in a
position to elaborate more completely on the engagement model that we are
pursuing in that particular domain.
We’re
enthusiastic about its prospects and as Jerry noted, we have the plan to
invest
to expand our presence in that market, you see, the time is right for that
for
us and we do think we have a distinguished set of services and message to
bring
to there and we'll elaborate more completely next time we're
together.
NIAMH
ALEXANDER: OK. That's very helpful thanks.
OPERATOR:
Your next question is a follow up question from Robert Lee from KBW. You
may go
ahead.
11
ROBERT
LEE: Thank you again. I have a question on the private client business, just
thinking a little bit about your 2007 objectives, I know Lew you mentioned
this
being office foot prints probably going to stay as it is, but what are your
objectives for growing the number of advisors and that, you had a pretty
healthy
increase this year, are you starting to get to a point where you've got to
let
the advisors you have sort of mature somewhat or do you see a lot of opportunity
to continue to grow that at a double digit rate?
LEW
SANDERS: Yes, we think that we can expand our field force in the double digit
area in '07 without any additional physical expansion. And of course, we
are
planning on the maturity of the large increase in the sales force that was
made
over the last several years to assist in driving that business. So really
both
factors still apply.
ROBERT
LEE: OK. And maybe also in private client, is it possible to just get a little
sense of maybe how your client mix there has been evolving of past couple
years,
you know, are you continuing to see that incrementally of more and more of
your
business is coming from ultra high net worth or maybe a little more color
on
that?
LEW
SANDERS: Yes. The business has for some number of years been moving northward
from a demographic profile perspective and our presence in the ultra high
net
worth component has grown the fastest of all of the segments that we serve
in
that market.
And
that's not to say that we're not still achieving noteworthy growth in smaller
relationships, we are, but I think our service offering is especially
distinguished in the high end because our investment planning skills, especially
in the domain of complex investment more of planning problems are in our
judgment differentiated. And our success in the market seems to support that
assertion.
ROBERT
LEE: Great. Thank you again.
OPERATOR:
Now we have time for one last question from Cynthia Mayer from Merrill Lynch,
you may go ahead.
CYNTHIA
MAYER, ANALYST, MERRILL LYNCH: Hi. Hoping I could just make it two very quick
ones. One is on the comp, is any of the comp costs marked to market deferred
comp this quarter?
JERRY
LIEBERMAN: It's small.
CYNTHIA
MAYER: OK. And the other part I wondered is just drilling down to the hedge
fund
feed performance fees, should we assume most of those were from global
diversified?
LEW
SANDERS: Actually, you shouldn't. I think the way you should see performance
fees in the firm whether they're hedge funds or long only services is that
they're sourced from actually a fairly diversified group of
services.
And
the
services themselves are sourcing their alpha from an increasingly diverse
array
of capital market opportunities. So for instance, global diversified, as
you
know in its most advanced form looks to long short equity, long short fixed
income currency as well as commodities as the basis for its return
stream.
So,
it
too has a degree of internal diversification, which we think is one of its
salient features competitively and one of the factors that has actually been
providing the return premiums we've been earning.
CYNTHIA
MAYER: OK.
LEW
SANDERS: The point is since it's not one thing, it's many things.
JERRY
LIEBERMAN: And it's global -- including global opportunities, global diverse
side as you have mentioned, I mean the fact that different flavors are global
diversified, we have some kind of long short equity hedge, it's really several
services across multiple clients.
CYNTHIA
MAYER: Great. Thanks a lot.
12
JERRY
LIEBERMAN: And I don't want to -- I also want to mention that, as I mentioned
earlier, a significant part, a real part of these performance fees are also
long
only services.
And
that's a feature that we see not only in the fourth quarter, but throughout
the
year. And for us, we think that this is an opportunity as clients look to
do
this if we can perform for them, which is what we're paid to do, this is
actually goes in our favor.
CYNTHIA
MAYER: Great. Thanks a lot.
OPERATOR:
There are no further questions sir.
PHILIP
TALAMO: Thanks everyone for participating in the call. If you have any further
questions, feel free to contact the IR team at any time. Enjoy the rest of
your
evening.
OPERATOR:
This concludes today's conference call, you may now disconnect and have a
great
evening.
END
13